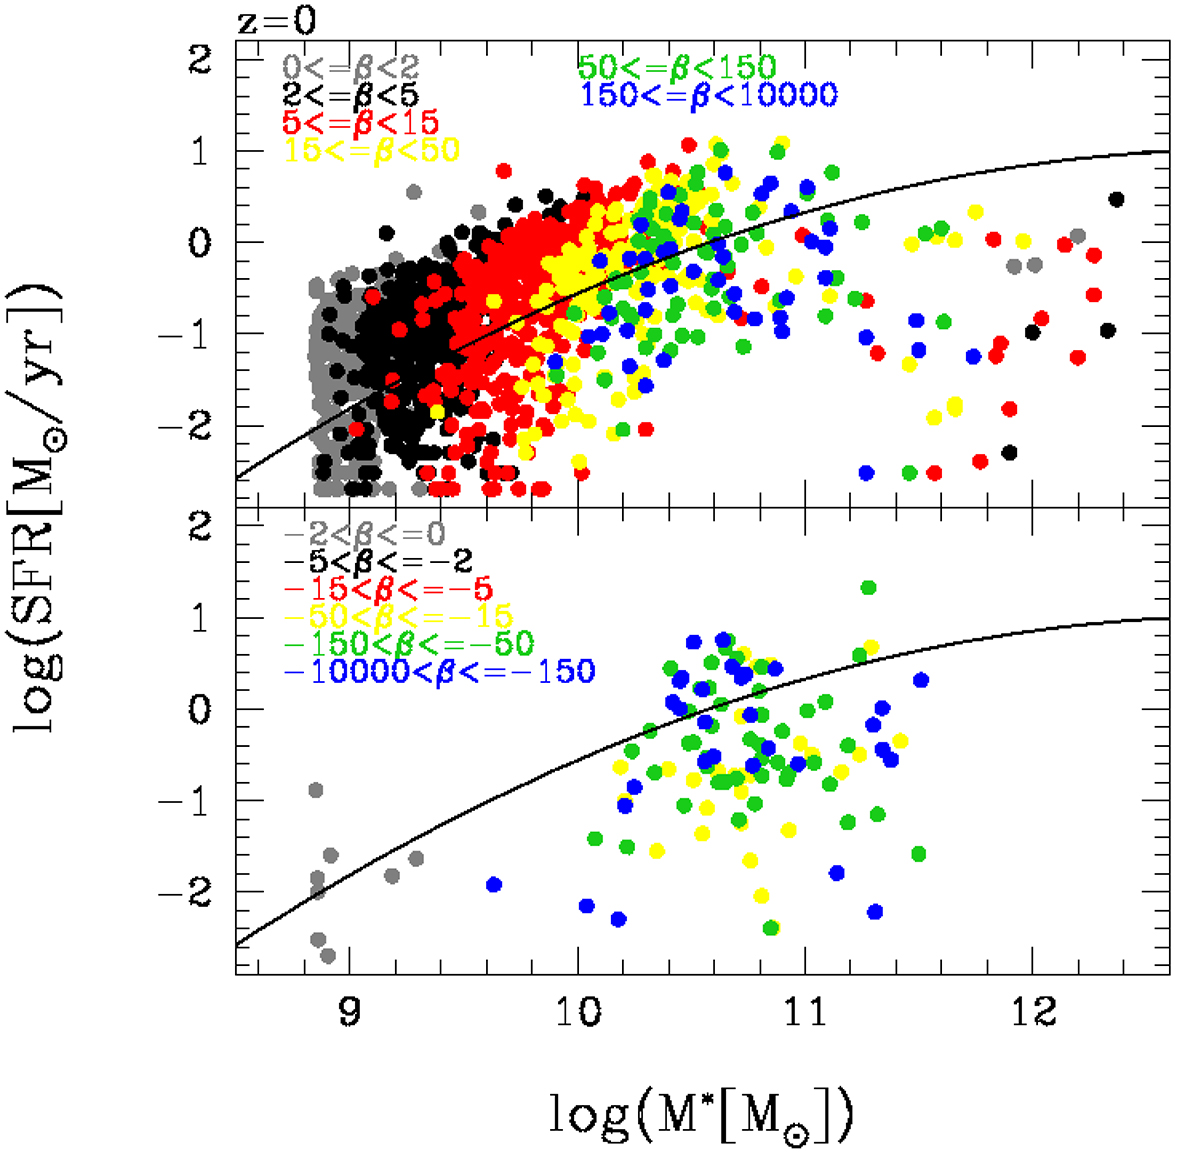
Fig. 18.
Download original image
Main Sequence (MS) relation at z = 0 for the Illustris-1 galaxies. The different colors of the dots mark the different intervals of β (listed in the figure). The upper panel considers only the positive values of β, while the bottom panel the negative ones. The black solid line is the fit of the data as proposed by Popesso et al. (2023).
Current usage metrics show cumulative count of Article Views (full-text article views including HTML views, PDF and ePub downloads, according to the available data) and Abstracts Views on Vision4Press platform.
Data correspond to usage on the plateform after 2015. The current usage metrics is available 48-96 hours after online publication and is updated daily on week days.
Initial download of the metrics may take a while.