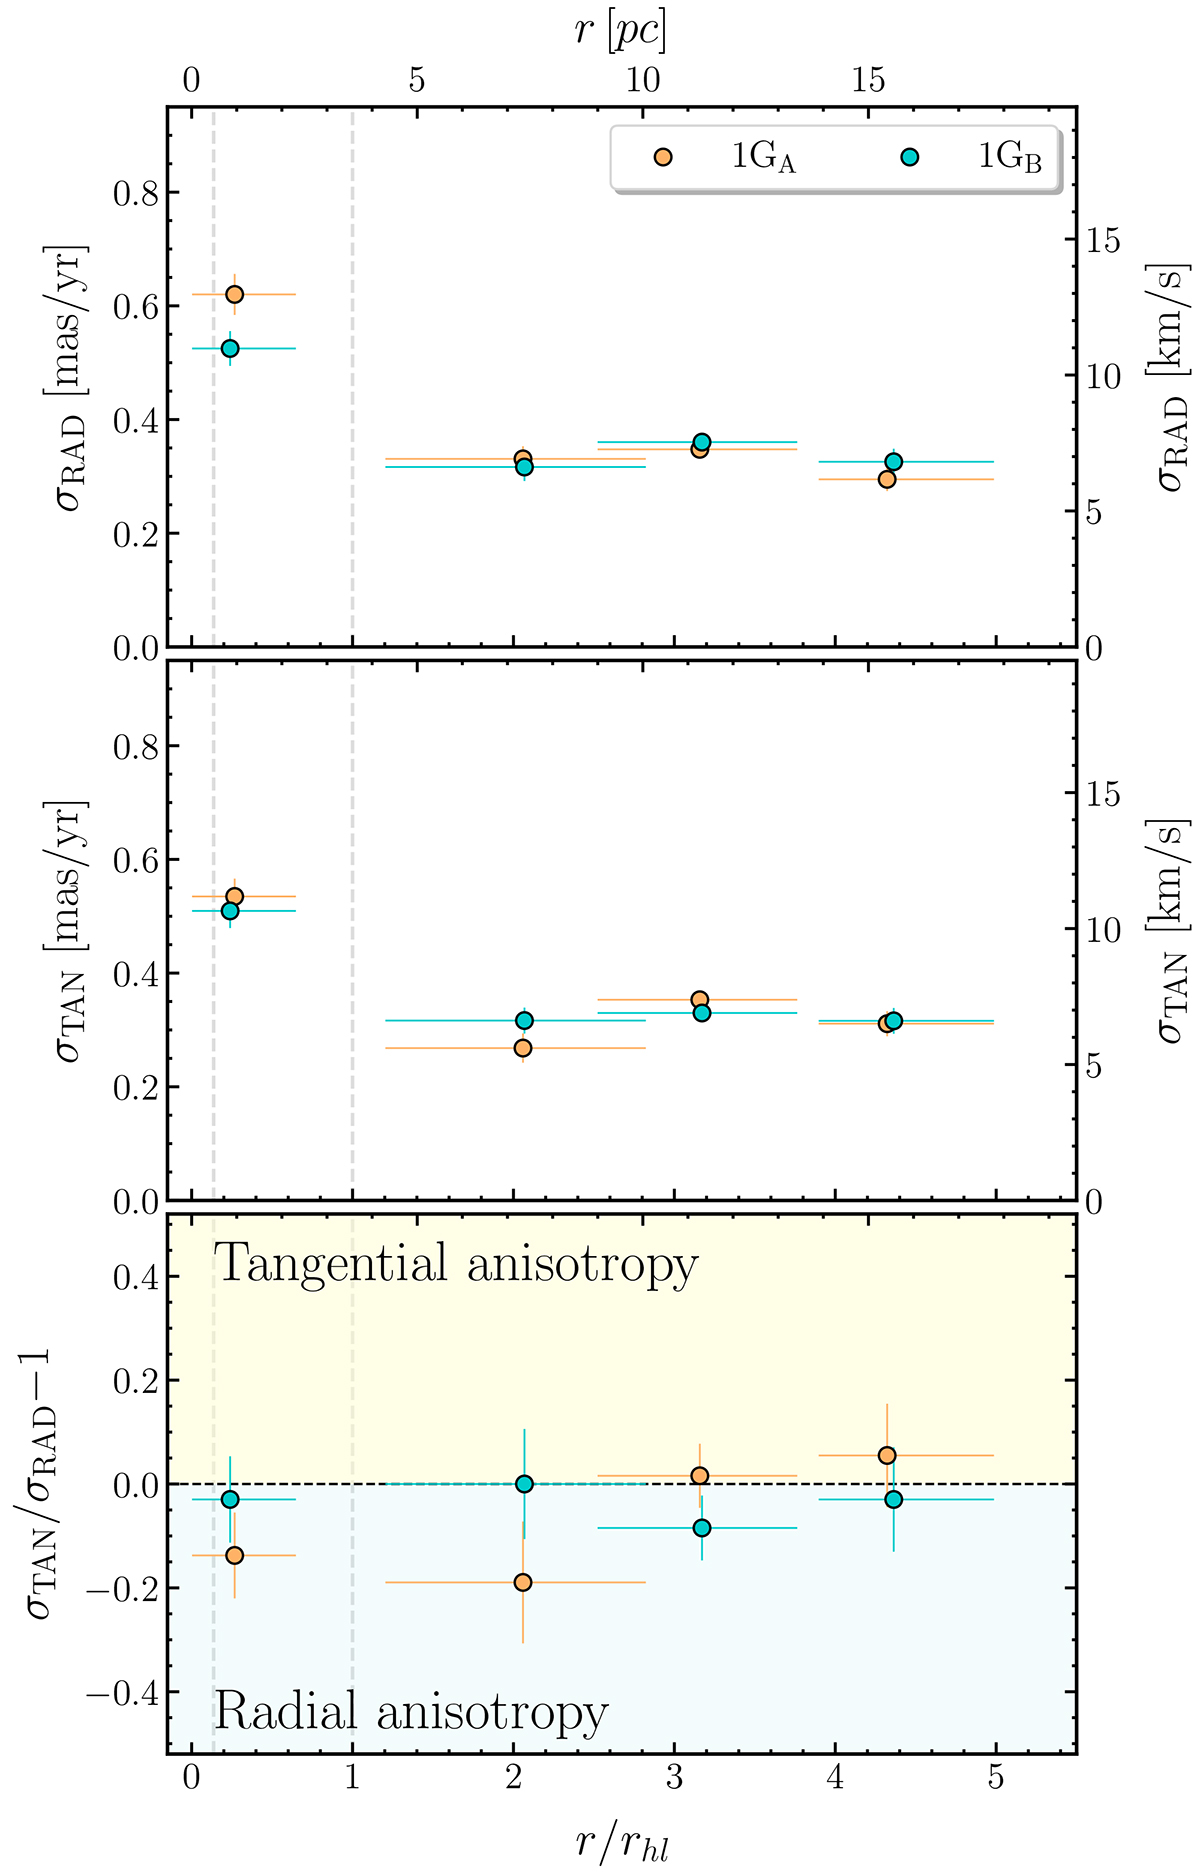
Fig. 9.
Download original image
Velocity dispersion profile along the radial (top panel) and tangential (middle panel) direction, together with the corresponding anisotropy profile (bottom panel). In all the panels, orange and cyan points indicate 1GA and 1GB stars, respectively, while the gray dashed lines correspond to the core and the half-light radius. On the bottom axis, the distance from the cluster center is normalized to the half-light radius from Baumgardt & Hilker (2018, rhl = 2.78 arcmin). On the top axis, instead, the radial coordinate is converted to parsec by adopting a distance of 4.41 kpc (Baumgardt & Hilker 2018). The horizontal bars mark the extension of each radial interval.
Current usage metrics show cumulative count of Article Views (full-text article views including HTML views, PDF and ePub downloads, according to the available data) and Abstracts Views on Vision4Press platform.
Data correspond to usage on the plateform after 2015. The current usage metrics is available 48-96 hours after online publication and is updated daily on week days.
Initial download of the metrics may take a while.