Fig. 6.
Download original image
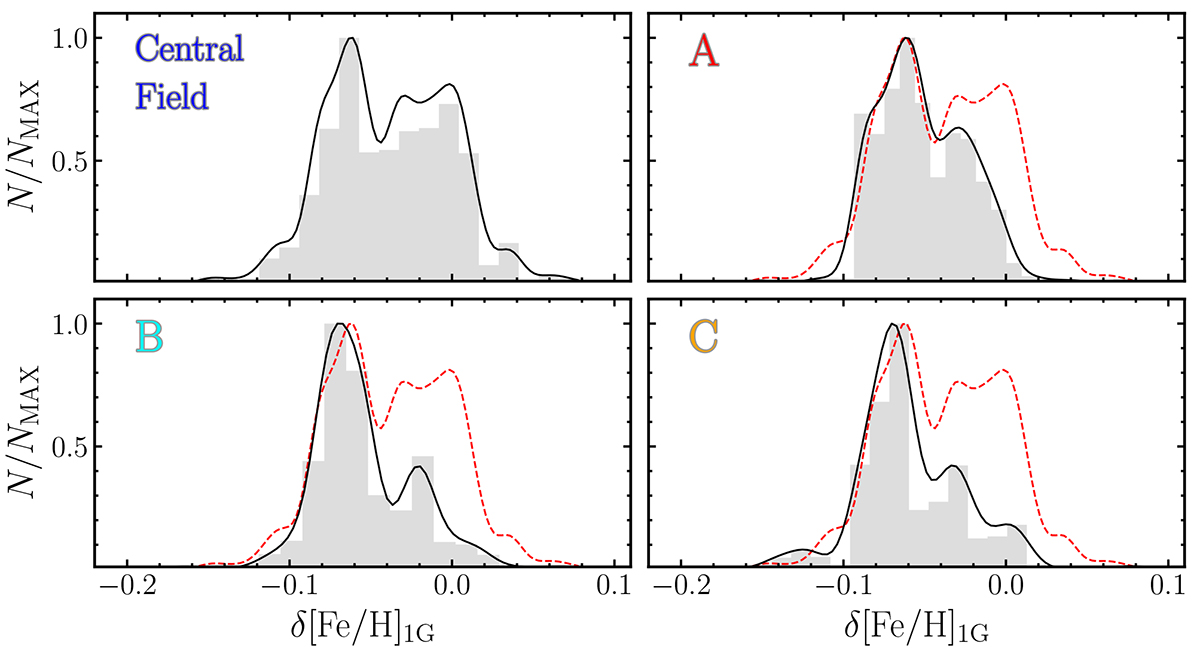
Histograms of the 1G metallicity distribution inferred from RGB stars within the cluster center (top left) and M dwarfs of fields A (top right), B (bottom left), and C (bottom right). In each panel the corresponding kernel-density distribution is superimposed on the histograms with the continuous black line, whereas the red dashed line represents the kernel-density distribution derived for RGB stars in the cluster core.
Current usage metrics show cumulative count of Article Views (full-text article views including HTML views, PDF and ePub downloads, according to the available data) and Abstracts Views on Vision4Press platform.
Data correspond to usage on the plateform after 2015. The current usage metrics is available 48-96 hours after online publication and is updated daily on week days.
Initial download of the metrics may take a while.