Fig. 5.
Download original image
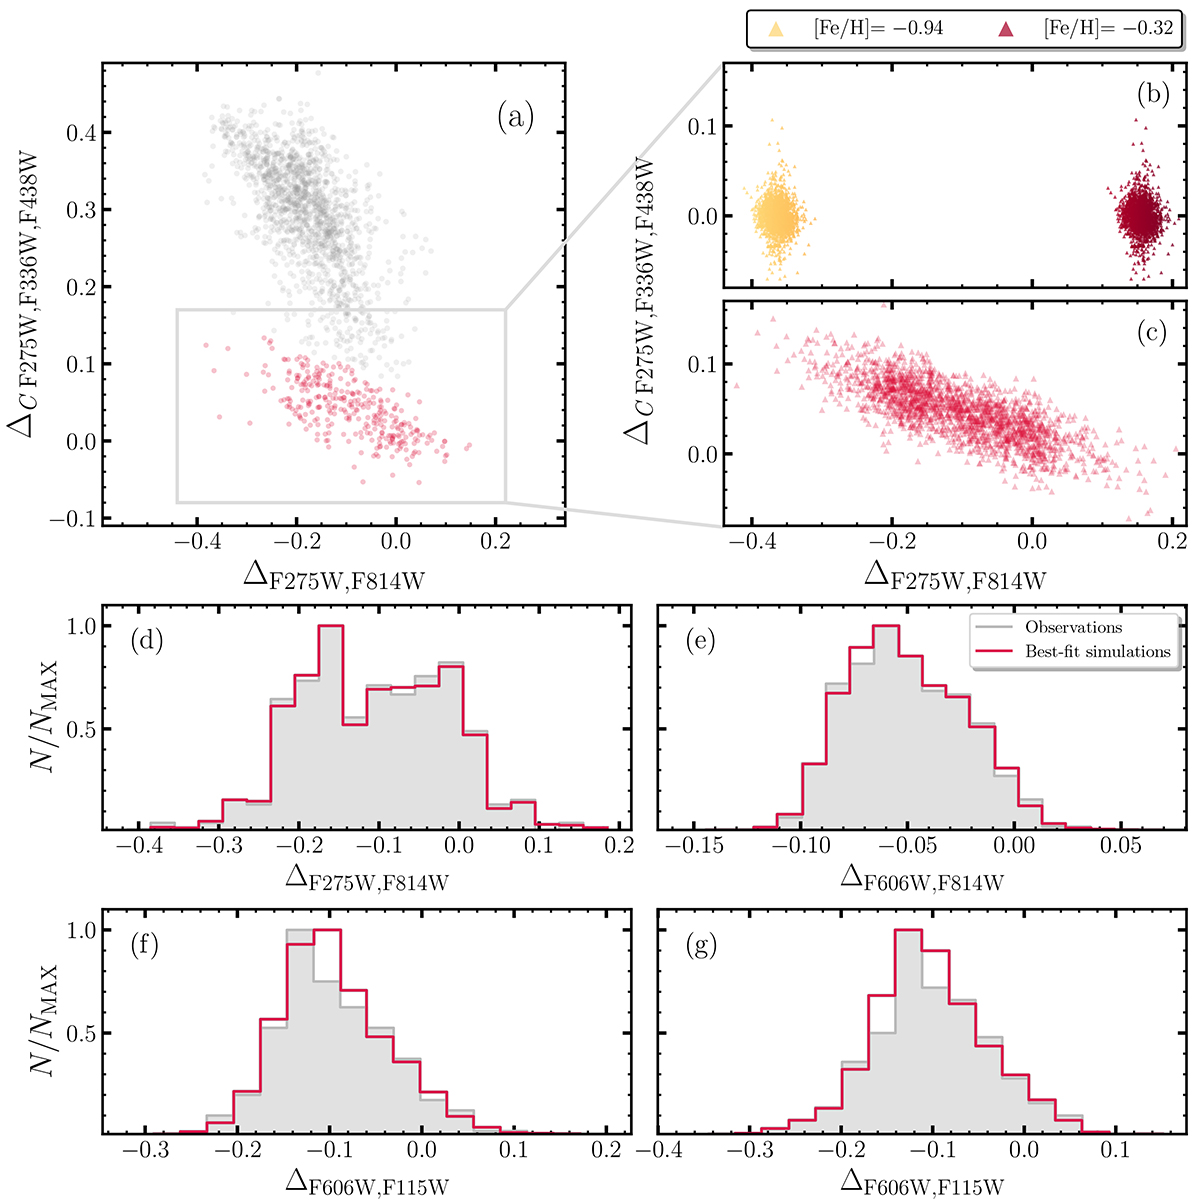
Illustration of the procedure to derive the metallicity distributions of 1G stars in 47 Tucanae. Top panels: comparison between the observed ΔC F275W, F336W, F438W vs. ΔF275W, F814W ChM for 1G stars within the central field (red points in panel a) and the ChM of simulated 1G stars (panels b and c). The stars in the yellowish ChM in panel b have an iron abundance of [Fe/H] = −0.94, while those of the reddish ChM have [Fe/H] = −0.32. The ChM of panel c represents the best-fitting simulation. The number of simulated 1G stars is about five times larger than the observed stars. Bottom panels: histograms of the observed ΔF275W, F814W (ΔF606W, F814W, ΔF606W, F115W) distributions inferred from 1G stars within the cluster center (panel d), fields A, B, and C (panels e, f, and g, respectively). In each panel, the red line corresponds to the simulated 1G ΔF275W, F814W (ΔF606W, F814W, ΔF606W, F115W) distribution that provides the best match with the observed data.
Current usage metrics show cumulative count of Article Views (full-text article views including HTML views, PDF and ePub downloads, according to the available data) and Abstracts Views on Vision4Press platform.
Data correspond to usage on the plateform after 2015. The current usage metrics is available 48-96 hours after online publication and is updated daily on week days.
Initial download of the metrics may take a while.