Open Access
Fig. 12.
Download original image
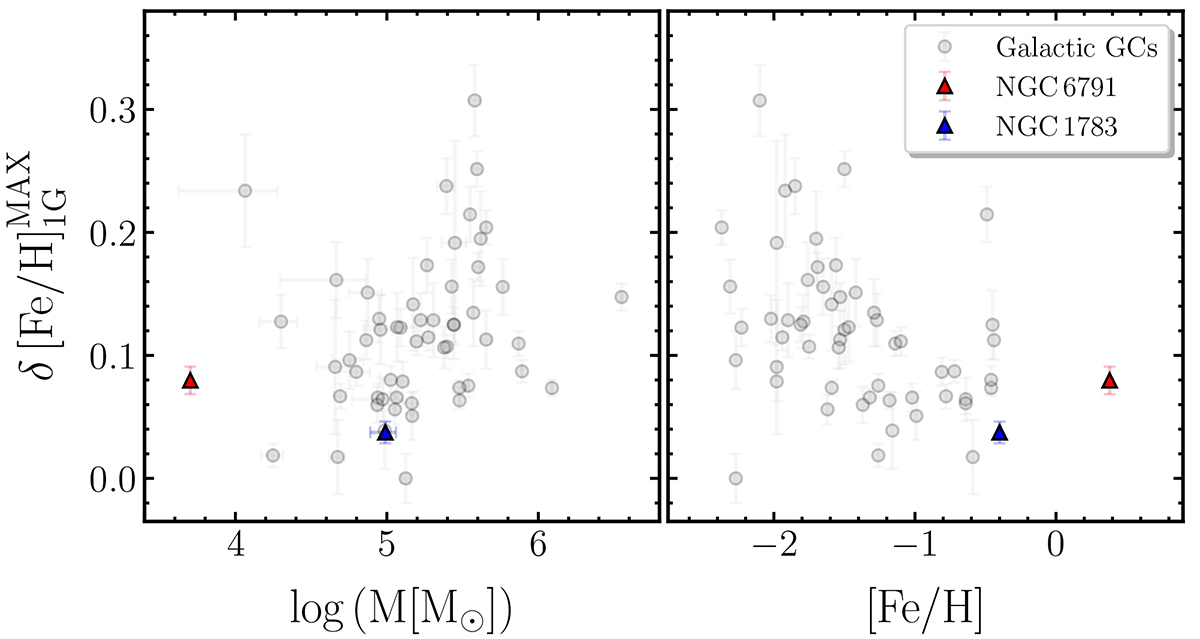
Maximum iron variations of 1G stars, δ[Fe/H]![]() , as a function of the logarithm of the cluster mass (left) and metallicity (right). Gray dots correspond to the 55 Galactic GCs analyzed by Legnardi et al. (2022), whereas NGC 6791 and NGC 1783 are marked with red and blue triangles, respectively.
, as a function of the logarithm of the cluster mass (left) and metallicity (right). Gray dots correspond to the 55 Galactic GCs analyzed by Legnardi et al. (2022), whereas NGC 6791 and NGC 1783 are marked with red and blue triangles, respectively.
Current usage metrics show cumulative count of Article Views (full-text article views including HTML views, PDF and ePub downloads, according to the available data) and Abstracts Views on Vision4Press platform.
Data correspond to usage on the plateform after 2015. The current usage metrics is available 48-96 hours after online publication and is updated daily on week days.
Initial download of the metrics may take a while.