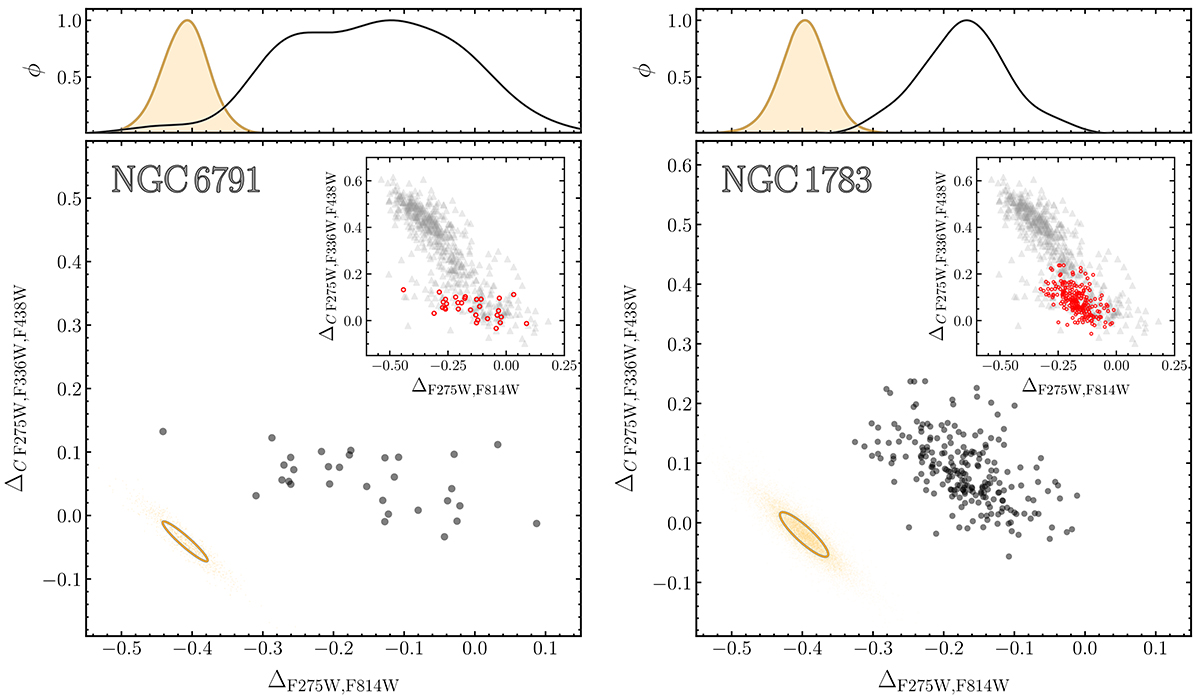
Fig. 10.

Download original image
ΔC F275W, F336W, F438W vs. ΔF275W, F814W ChMs for NGC 6791 (left) and NGC 1783 (right). In both panels the orange points in the bottom left corner indicate the distribution expected for a simple population derived from ASs, while the orange ellipses encircle the 68.27% of simulated points. The ΔF275W, F814W kernel-density distributions of observed and simulated stars are shown in black and orange, respectively, in the top panel of each figure. The insets show a comparison between the ChMs of the two simple-population clusters and that of the metal-rich GC NGC 6624 (Milone et al. 2017).
Current usage metrics show cumulative count of Article Views (full-text article views including HTML views, PDF and ePub downloads, according to the available data) and Abstracts Views on Vision4Press platform.
Data correspond to usage on the plateform after 2015. The current usage metrics is available 48-96 hours after online publication and is updated daily on week days.
Initial download of the metrics may take a while.


