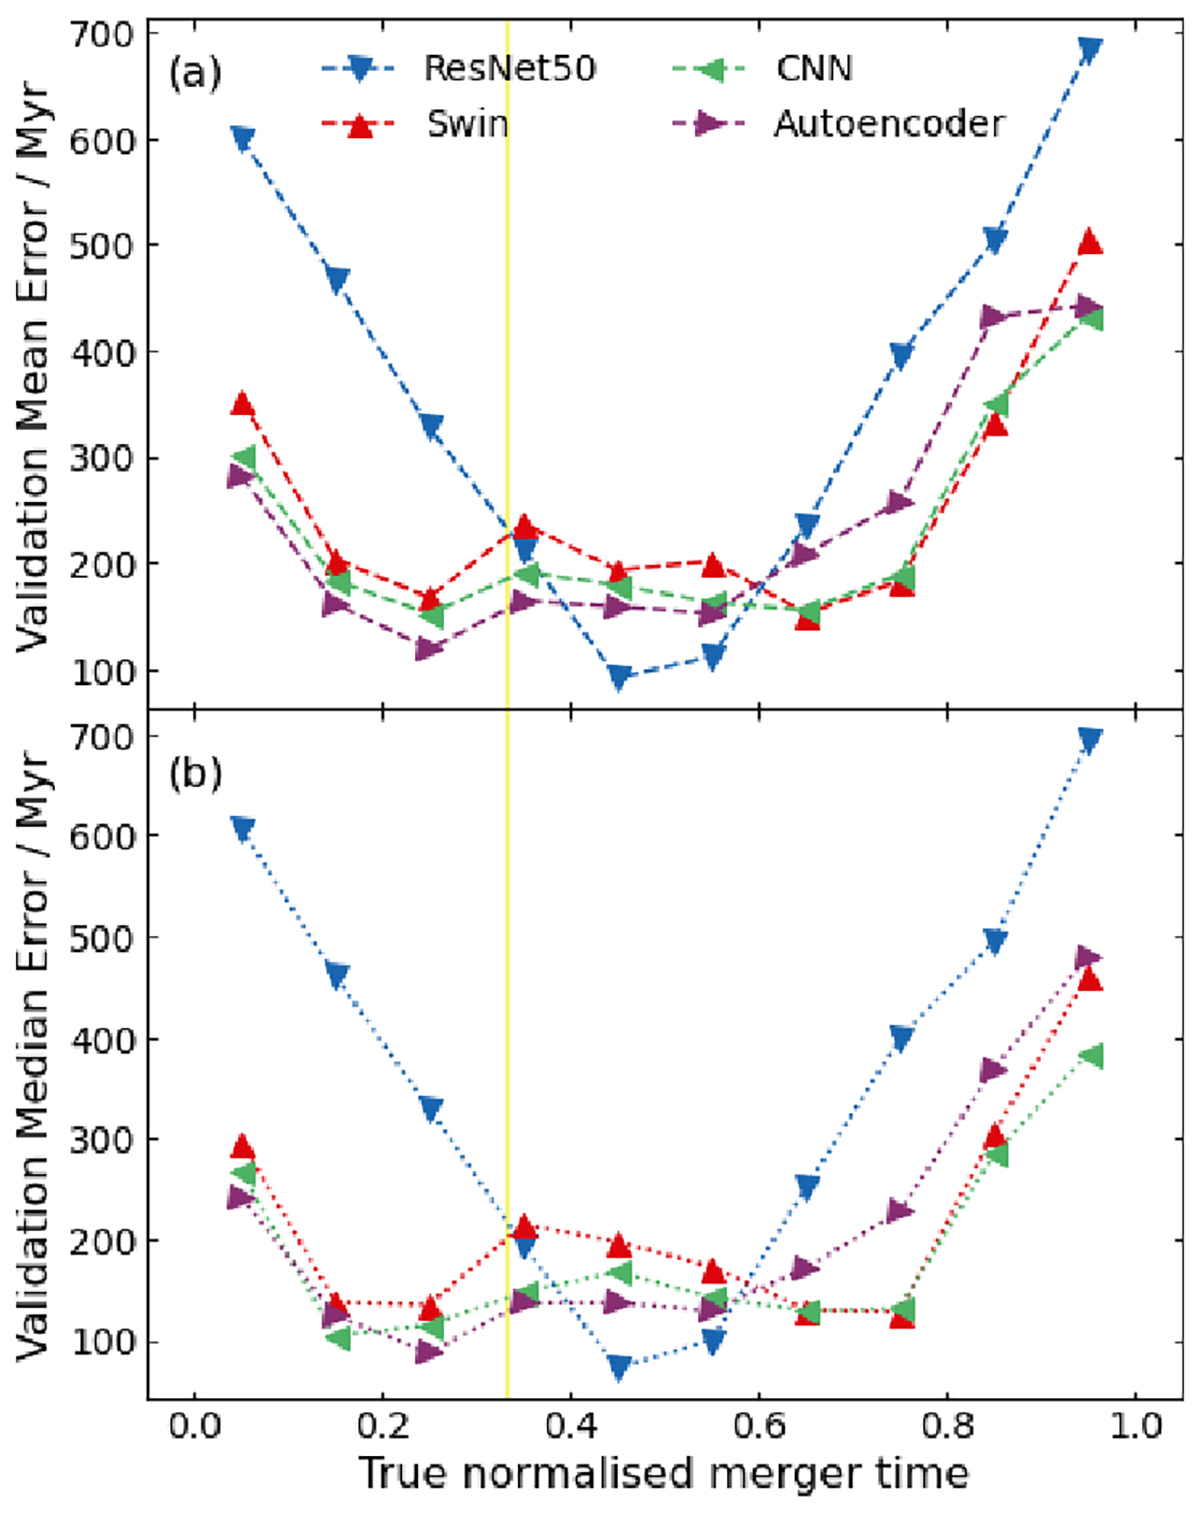
Fig. 7.
Download original image
Difference between true merger time and predicted merger time (error) as the normalised true merger time changes for ResNet50 (dark blue downward pointing triangle), Swin (red upward pointing triangle), CNN (green left pointing triangle), and autoencoder (purple right pointing triangle). Mean and median errors are shown in panels a and b, respectively. The vertical yellow line indicates when the true merger time is 0 Myr.
Current usage metrics show cumulative count of Article Views (full-text article views including HTML views, PDF and ePub downloads, according to the available data) and Abstracts Views on Vision4Press platform.
Data correspond to usage on the plateform after 2015. The current usage metrics is available 48-96 hours after online publication and is updated daily on week days.
Initial download of the metrics may take a while.