Open Access
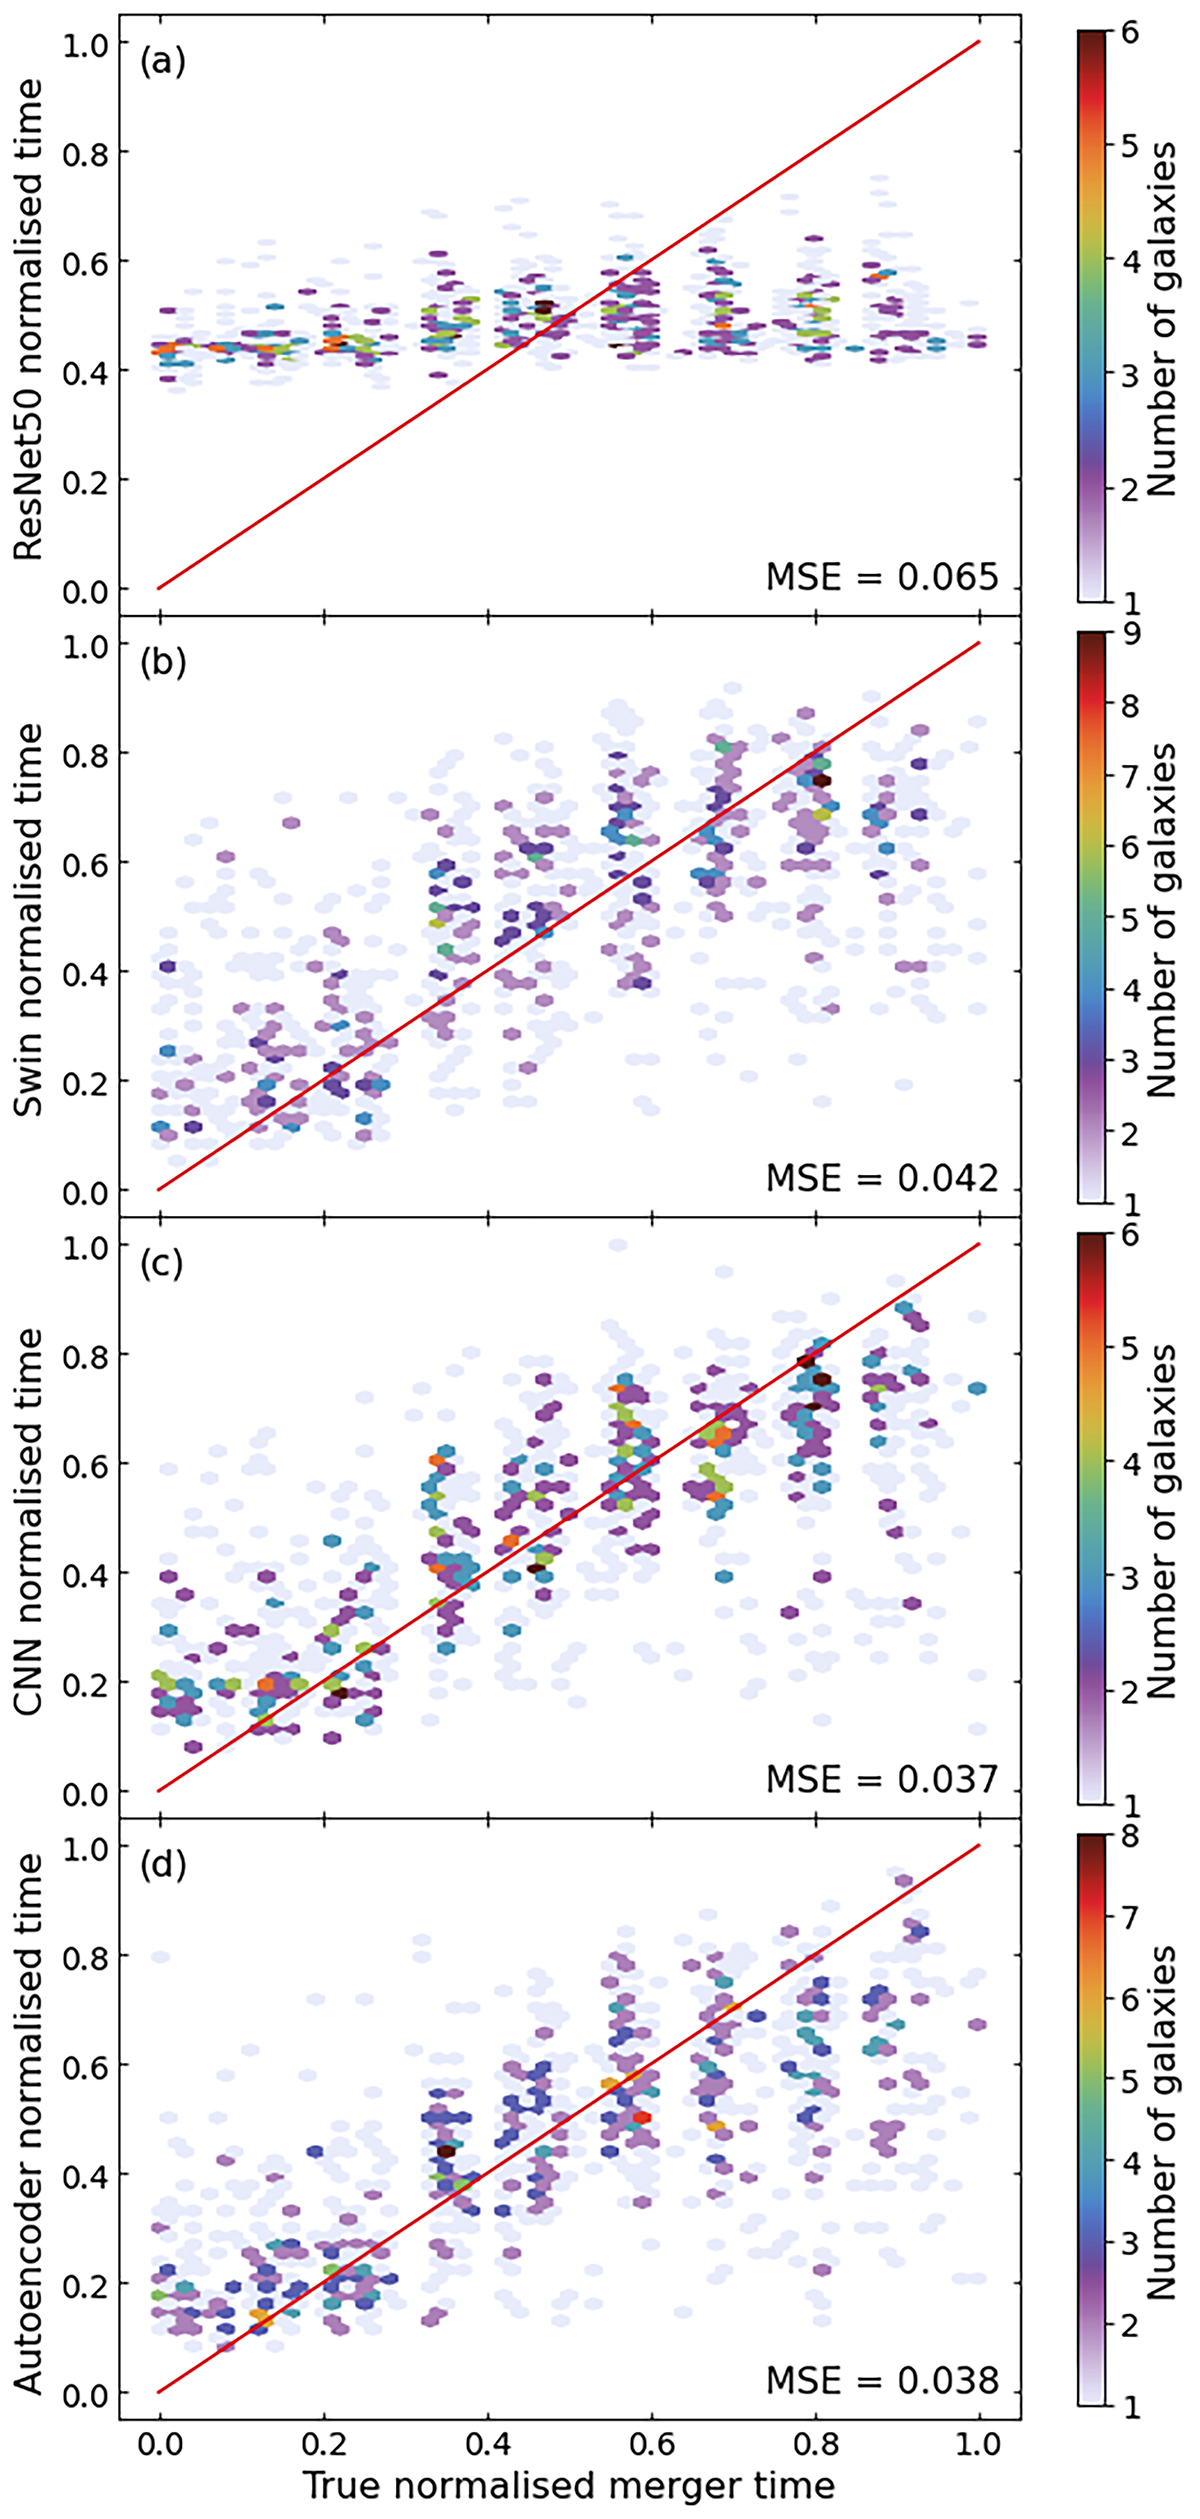
Fig. 6.
Download original image
Predicted normalised times of the validation data against true normalised times for (a) ResNet50, (b) Swin, (c) CNN, and (d) autoencoder. The colour corresponds to the number density from low (purple) to high (red). The red line indicates a one-to-one and corresponding MSE is shown in the bottom right of each panel.
Current usage metrics show cumulative count of Article Views (full-text article views including HTML views, PDF and ePub downloads, according to the available data) and Abstracts Views on Vision4Press platform.
Data correspond to usage on the plateform after 2015. The current usage metrics is available 48-96 hours after online publication and is updated daily on week days.
Initial download of the metrics may take a while.