Fig. 4.
Download original image
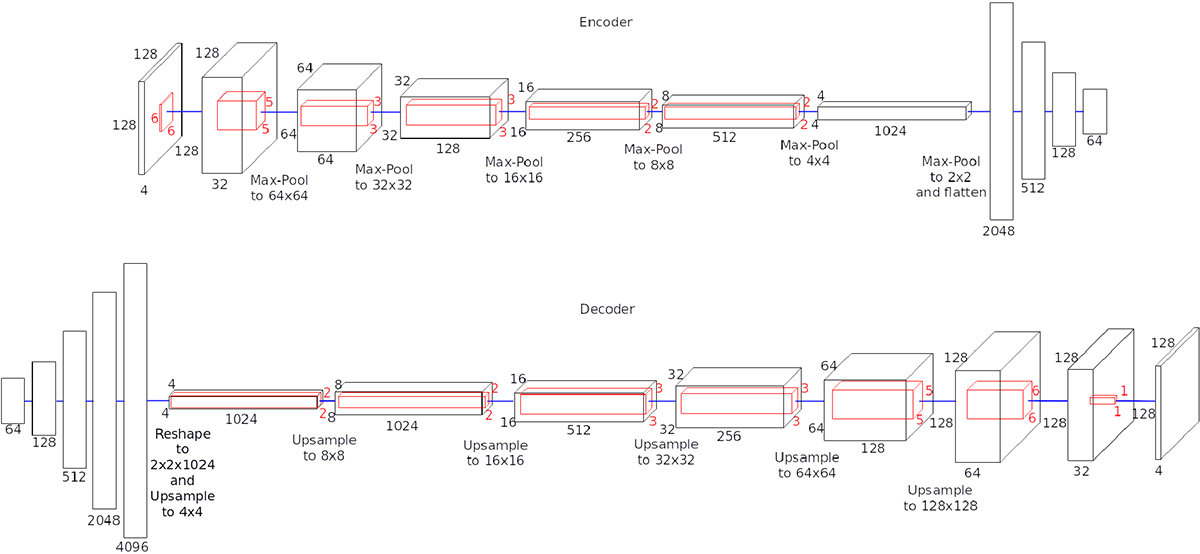
Architecture of the autoencoder. For clarity, the encoder is shown at the top and the decoder at the bottom. In reality the 64 neuron output of the encoder, on the upper right, and 64 value input to the decoder, on the lower left, are the same layer. The input to the encoder is a four channel, 128 × 128 pixel image, on the left of the encoder. The output from the decoder, on the right, is a four channel, 128 × 128 pixel image. The blue lines between layers symbolises the ReLU activation, batch normalisation, and dropout that is applied between layers. The sizes of the filters (red) and fully connected layers are shown.
Current usage metrics show cumulative count of Article Views (full-text article views including HTML views, PDF and ePub downloads, according to the available data) and Abstracts Views on Vision4Press platform.
Data correspond to usage on the plateform after 2015. The current usage metrics is available 48-96 hours after online publication and is updated daily on week days.
Initial download of the metrics may take a while.