Open Access
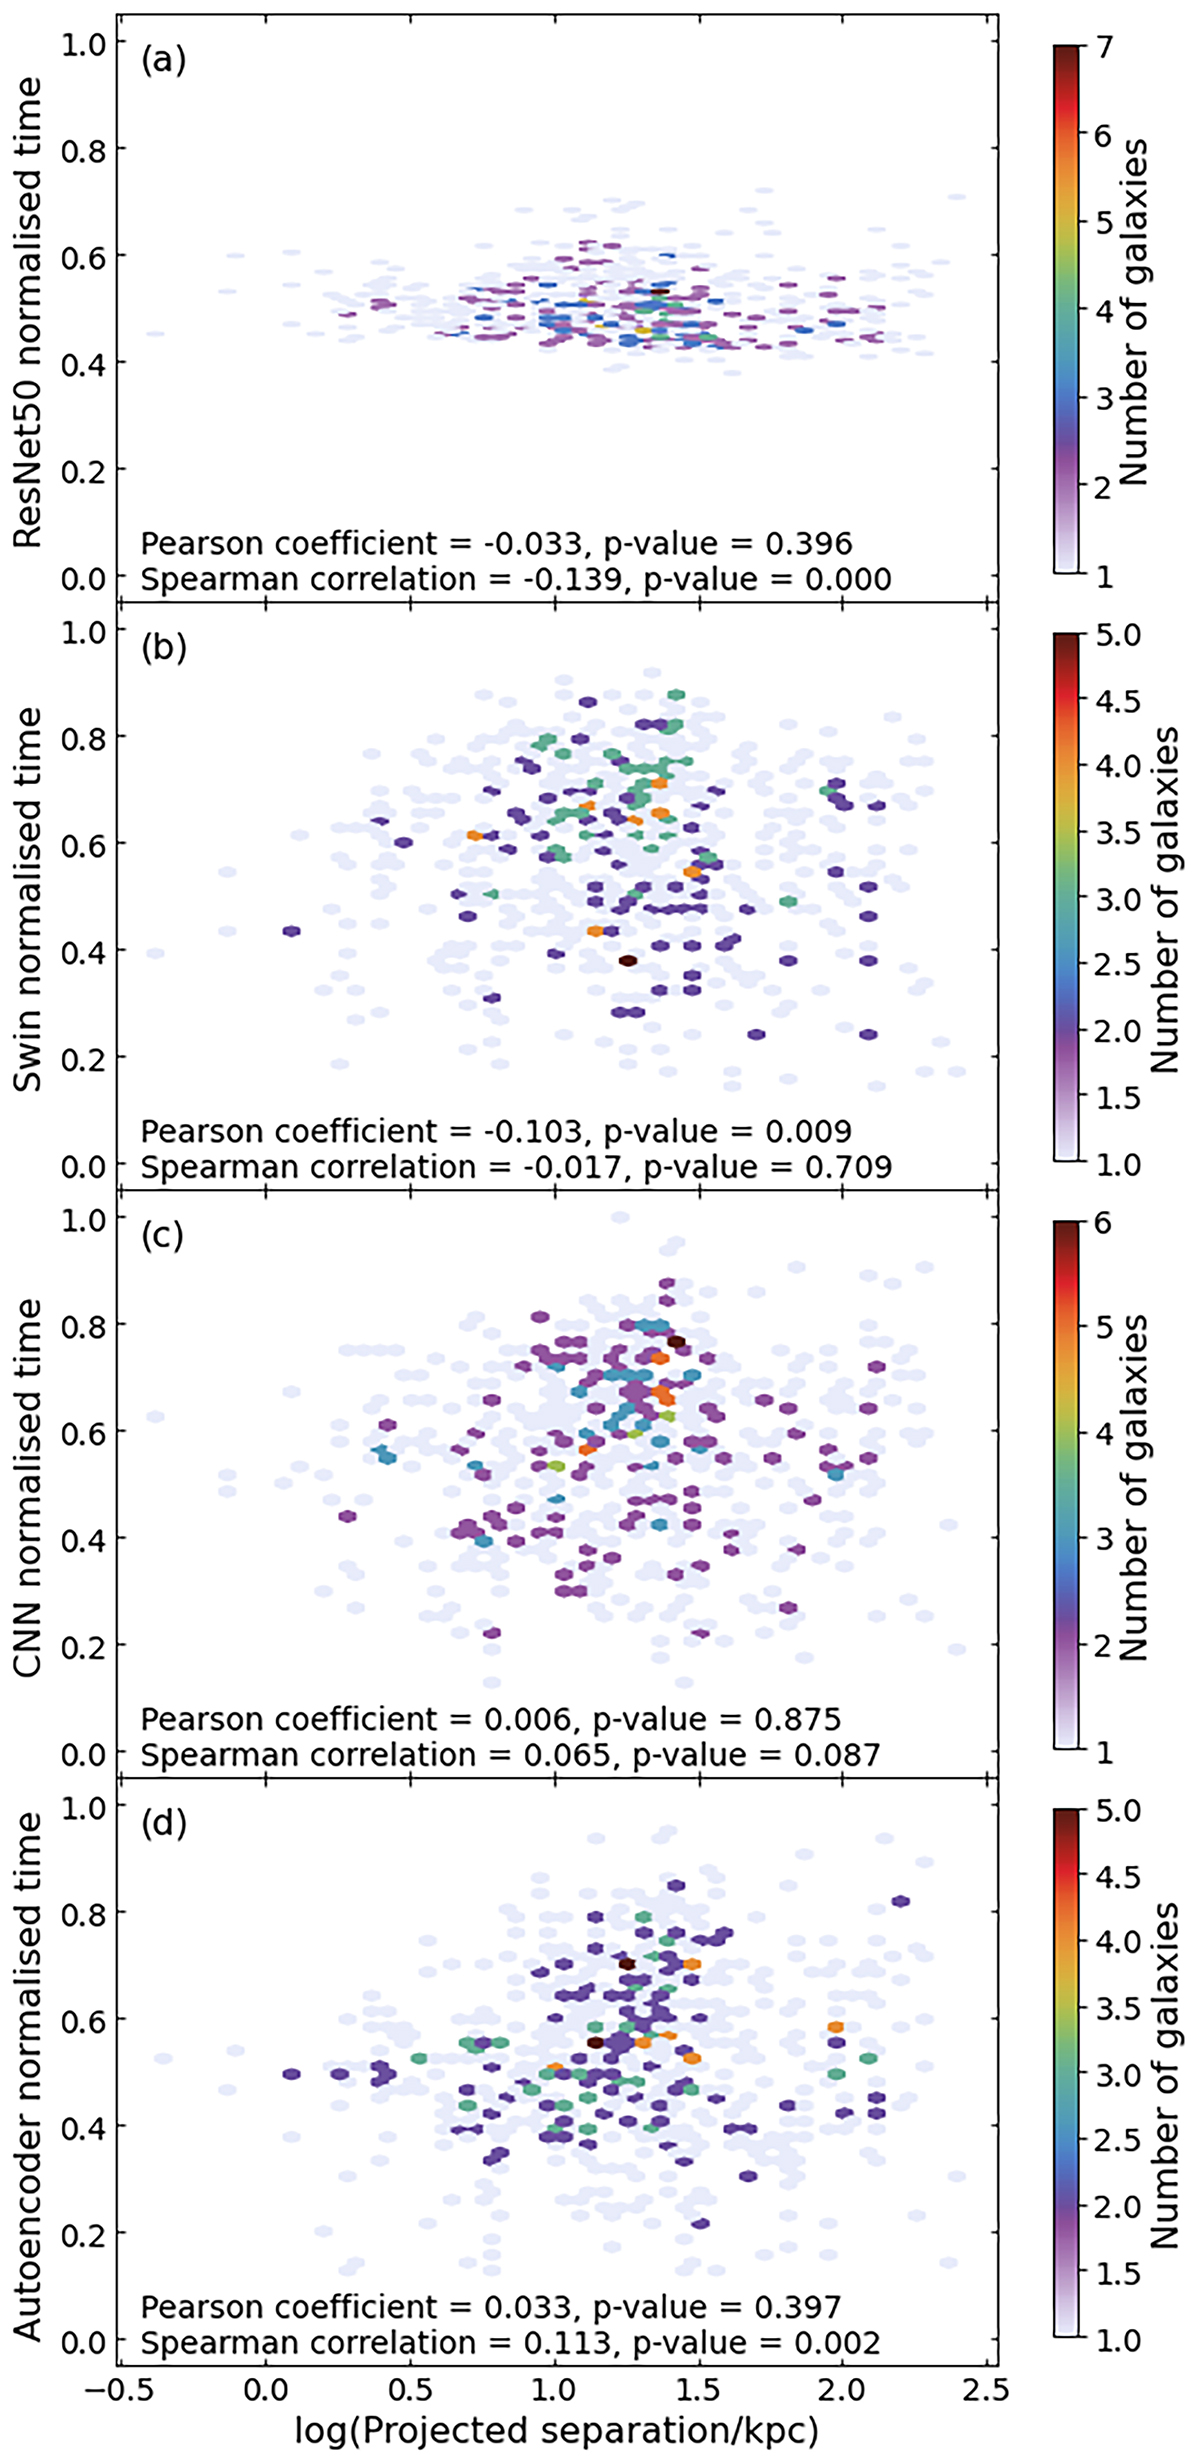
Fig. 14.
Download original image
Predicted merger times of the validation data set from (a) ResNet50, (b) Swin, (c) CNN, and (d) autoencoder against projected separation of merging galaxies at the time of imaging for pre-mergers. The colour corresponds to the number density from low (purple) to high (red).
Current usage metrics show cumulative count of Article Views (full-text article views including HTML views, PDF and ePub downloads, according to the available data) and Abstracts Views on Vision4Press platform.
Data correspond to usage on the plateform after 2015. The current usage metrics is available 48-96 hours after online publication and is updated daily on week days.
Initial download of the metrics may take a while.