Fig. 8.
Download original image
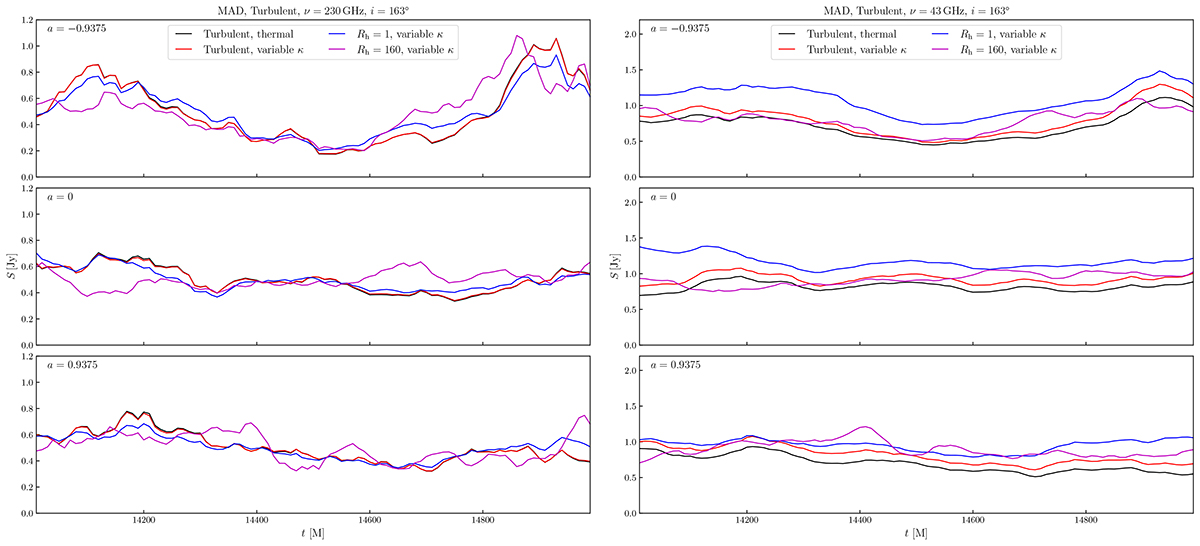
Light curves of flux at 230 GHz (left) and 43 GHz (right) with a 163° inclination angle. Curves are plotted using a = −0.9375 (top), 0 (middle), and 0.9375 (bottom). The different colors correspond to the different heating prescriptions and eDFs: the turbulent heating model with thermal eDF (black), the turbulent heating model with variable κ eDf (red), the R − β model with Rh = 1 in variable κ eDF (blue), and the R − β model with Rh = 160 in variable κ (magenta).
Current usage metrics show cumulative count of Article Views (full-text article views including HTML views, PDF and ePub downloads, according to the available data) and Abstracts Views on Vision4Press platform.
Data correspond to usage on the plateform after 2015. The current usage metrics is available 48-96 hours after online publication and is updated daily on week days.
Initial download of the metrics may take a while.