Fig. 7.
Download original image
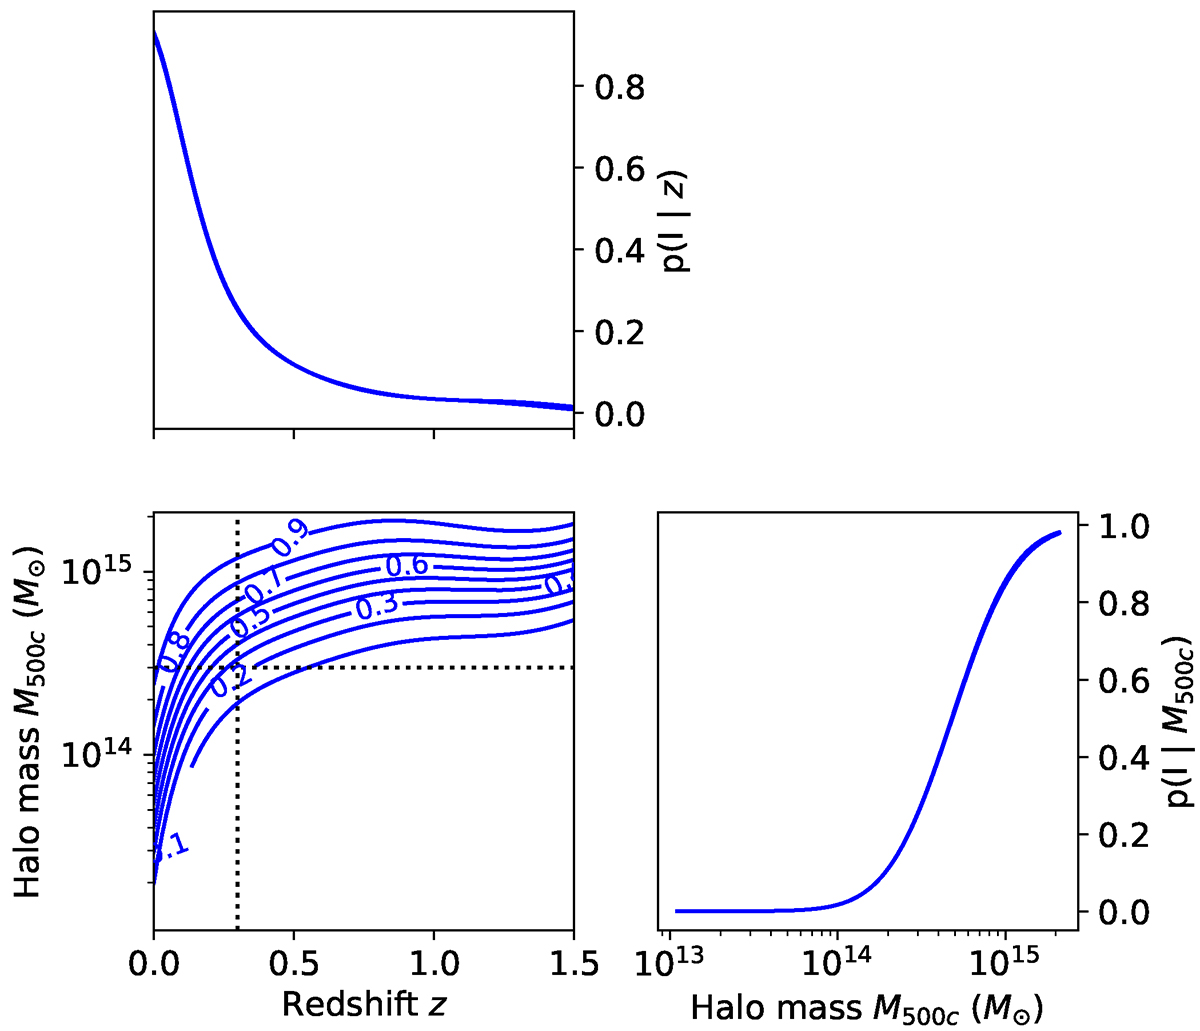
Representation of the model p(Imain|M500c, z) predicting a cluster to be detected and selected with an extent likelihood above three. The explanatory variables (features) are labels attached to simulated clusters in the twin simulation, standing for galaxy cluster M500c mass and cosmological redshift. The bottom-left panel represents contours of equal detection probability, labelled in steps of 0.1. Both one-dimensional curves (top-left and bottom-right panels) are slices through the function displayed in the bottom-left corner, at fixed z = 0.3 and M500c = 3 × 10¹⁴ M⊙ (indicated with dotted lines).
Current usage metrics show cumulative count of Article Views (full-text article views including HTML views, PDF and ePub downloads, according to the available data) and Abstracts Views on Vision4Press platform.
Data correspond to usage on the plateform after 2015. The current usage metrics is available 48-96 hours after online publication and is updated daily on week days.
Initial download of the metrics may take a while.