Fig. 6.
Download original image
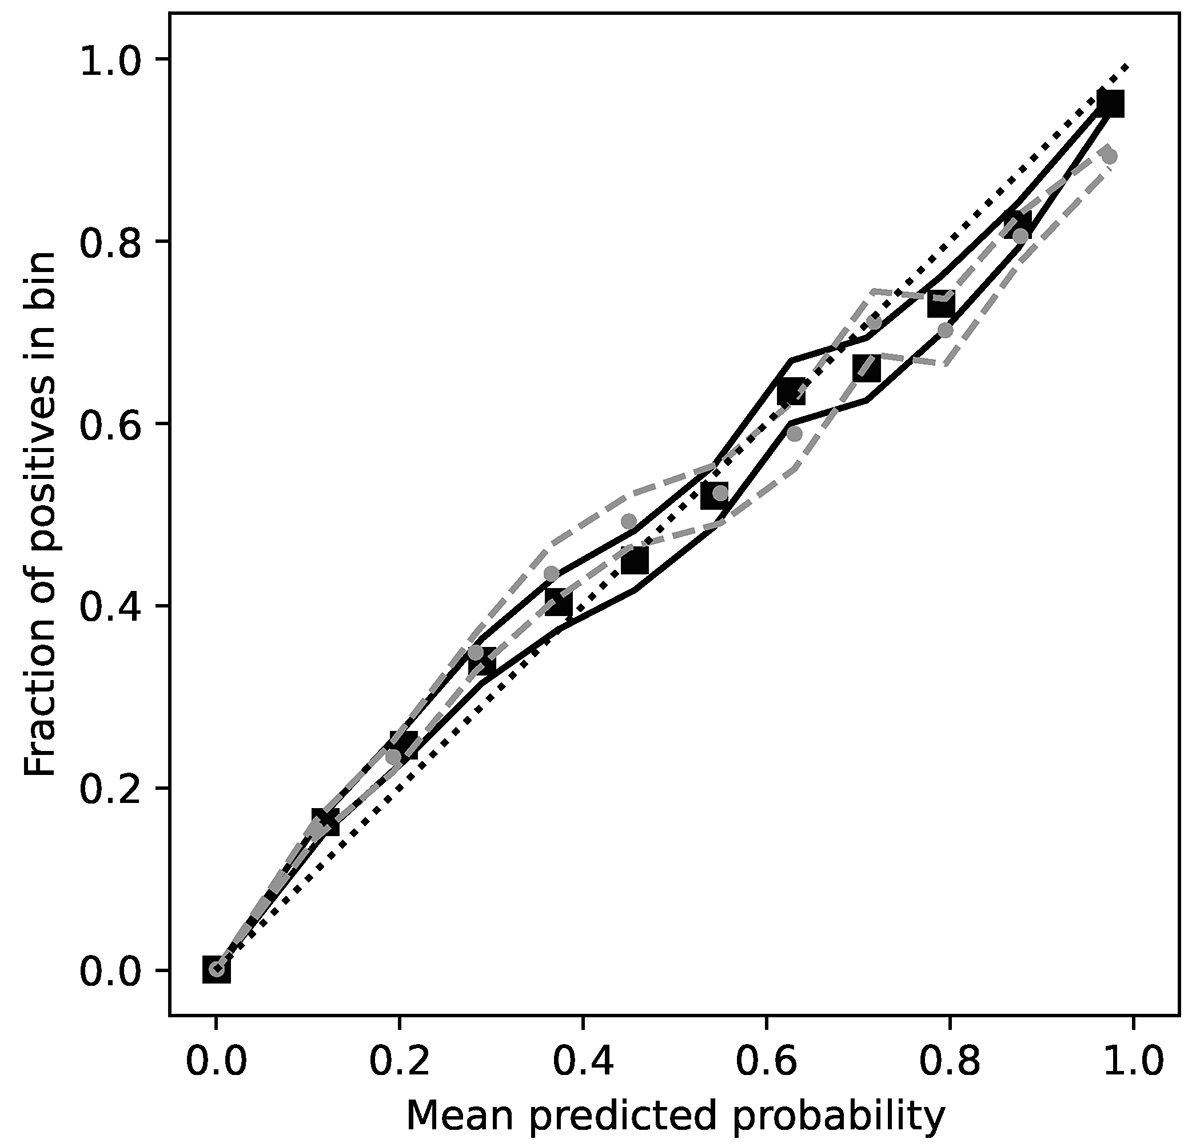
Reliablity of two different logistic models p(Imain|counts) to predict the probability of a cluster being selected given the values of surface brightness in radial bins. Each series of points is obtained with the test sample, by comparing probabilities predicted by the model (horizontal axis) with the actual fraction of selected objects (vertical axis) in each bin of probability. The envelopes materialise the 68% uncertainties (Appendix C). An ideal model would align along the 1:1 curve (thin dotted line). Black squares and plain lines correspond to the model taking 7 × 5 parameters as input, grey dots and dashed lines for the model using only cluster counts within 90″ to make its prediction.
Current usage metrics show cumulative count of Article Views (full-text article views including HTML views, PDF and ePub downloads, according to the available data) and Abstracts Views on Vision4Press platform.
Data correspond to usage on the plateform after 2015. The current usage metrics is available 48-96 hours after online publication and is updated daily on week days.
Initial download of the metrics may take a while.