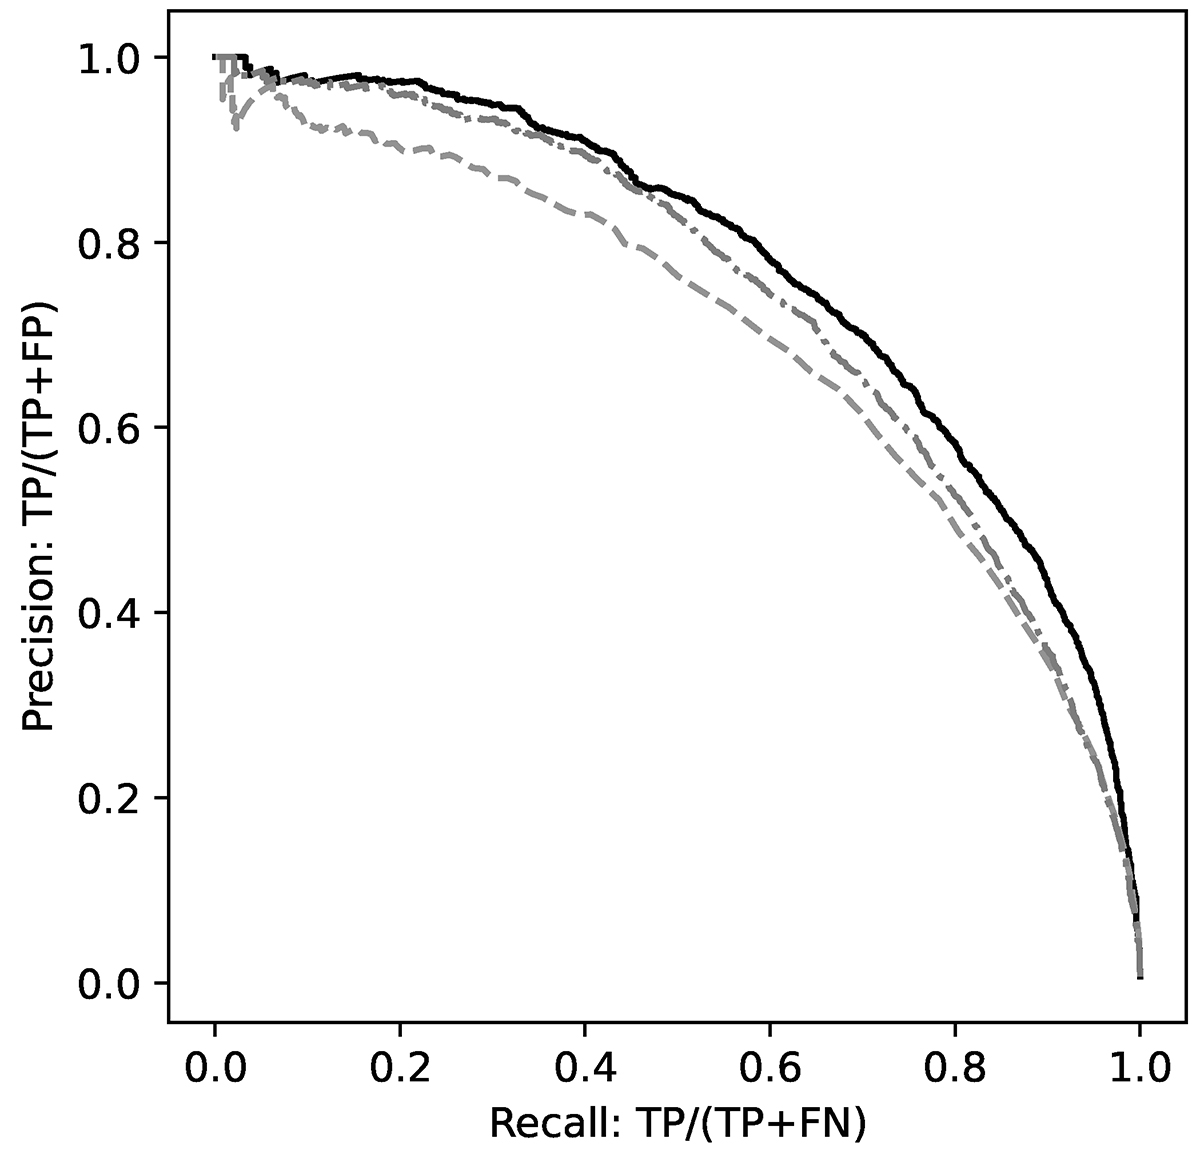
Fig. 5.

Download original image
Performance of three different logistic models p(Imain|counts) to predict a cluster as selected given the values of surface brightness in radial bins. The plain black line is obtained with a model using surface brightness values in 7 annuli for each of the 5 sky components. The dot-dashed line is for a model taking as input both cluster and background counts within 90″. The dashed grey line stands for a model using as input only the 90″ cluster counts. Each precision-recall curve results from model evaluations on the test sample. It is obtained by varying the threshold over which a cluster should be considered as selected and counting the number of true positives (TP), false negatives (FN) and false positives (FP).
Current usage metrics show cumulative count of Article Views (full-text article views including HTML views, PDF and ePub downloads, according to the available data) and Abstracts Views on Vision4Press platform.
Data correspond to usage on the plateform after 2015. The current usage metrics is available 48-96 hours after online publication and is updated daily on week days.
Initial download of the metrics may take a while.


