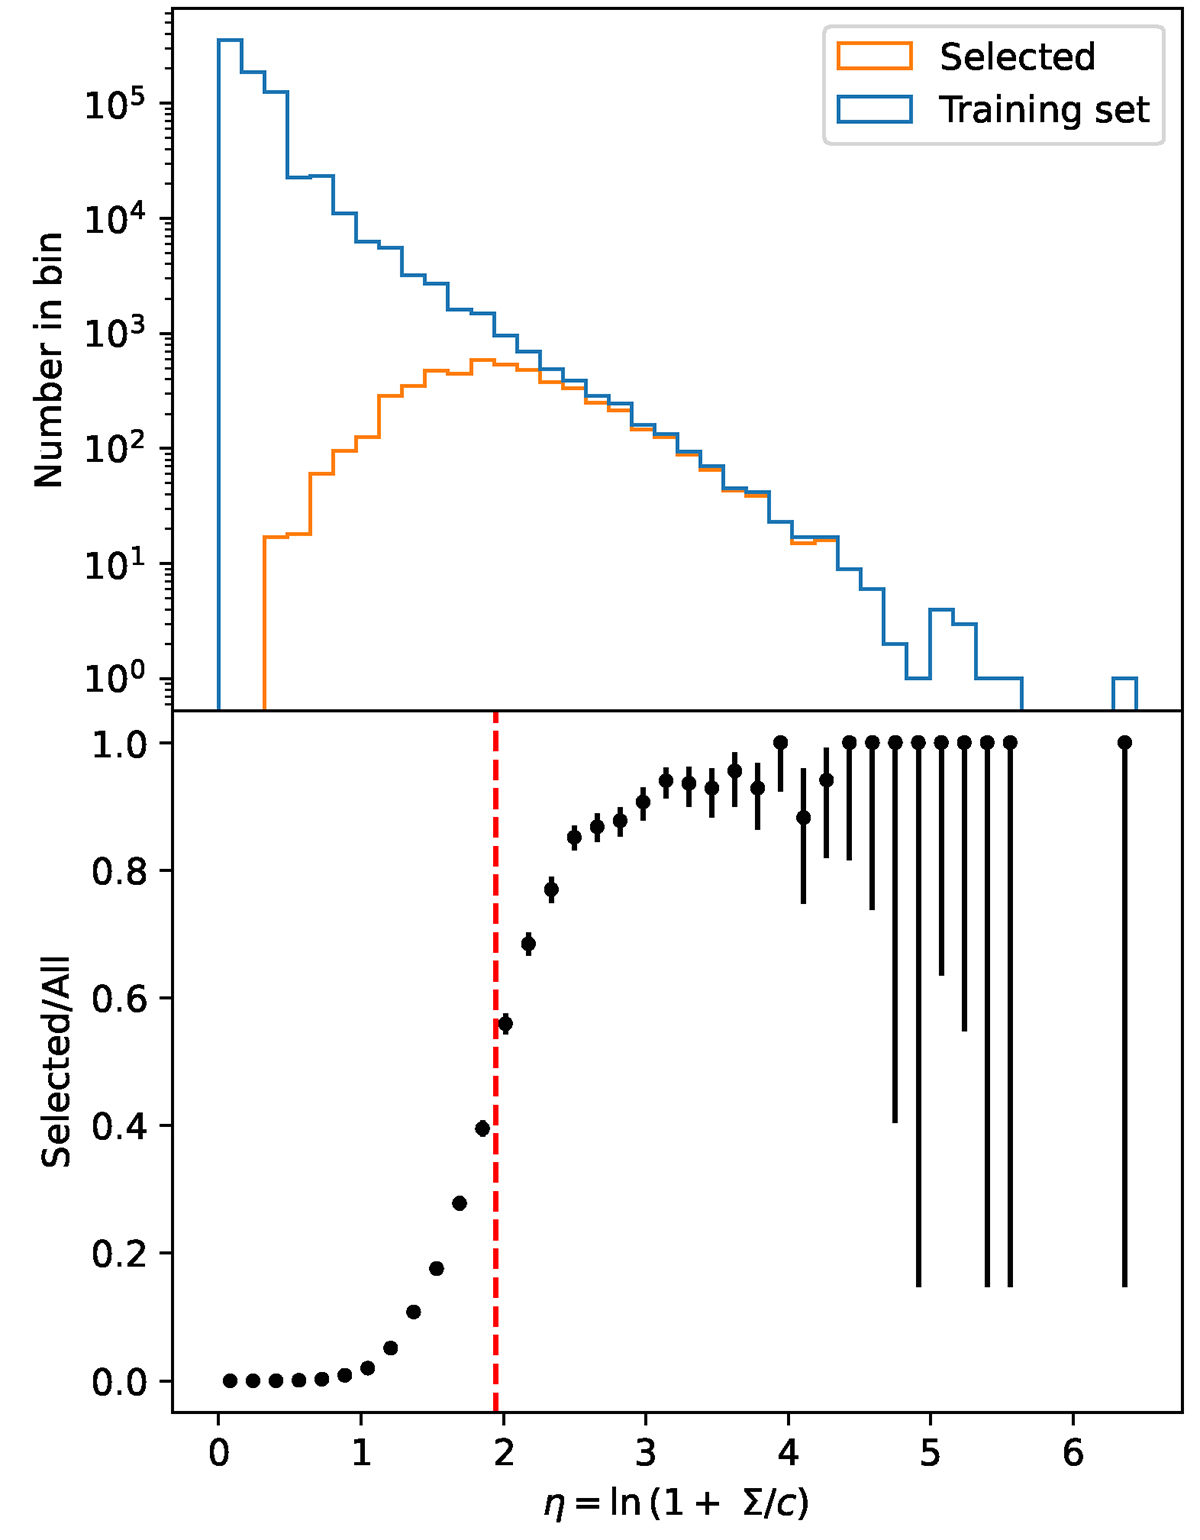
Fig. 3.
Download original image
Distribution of clusters in the training set as a function of Σ (units counts arcsec−2), and the average surface brightness in the 90″ radius around their centre. The x-axis is rescaled with c = 2 × 10⁻⁴ arcsec−2. Top panel: histogram of all simulated clusters (blue) and histogram of the subset of those found as extended by eSASS (orange). Bottom panel: dots indicate the ratio of the histograms (empirical selection rate). Error bars are the 68% confidence range estimated according to Appendix C. The vertical dashed line indicates the transition ![]() in the logistic model described by Eqs. (3) and (4) – corresponding to N ≃ 30 counts.
in the logistic model described by Eqs. (3) and (4) – corresponding to N ≃ 30 counts.
Current usage metrics show cumulative count of Article Views (full-text article views including HTML views, PDF and ePub downloads, according to the available data) and Abstracts Views on Vision4Press platform.
Data correspond to usage on the plateform after 2015. The current usage metrics is available 48-96 hours after online publication and is updated daily on week days.
Initial download of the metrics may take a while.