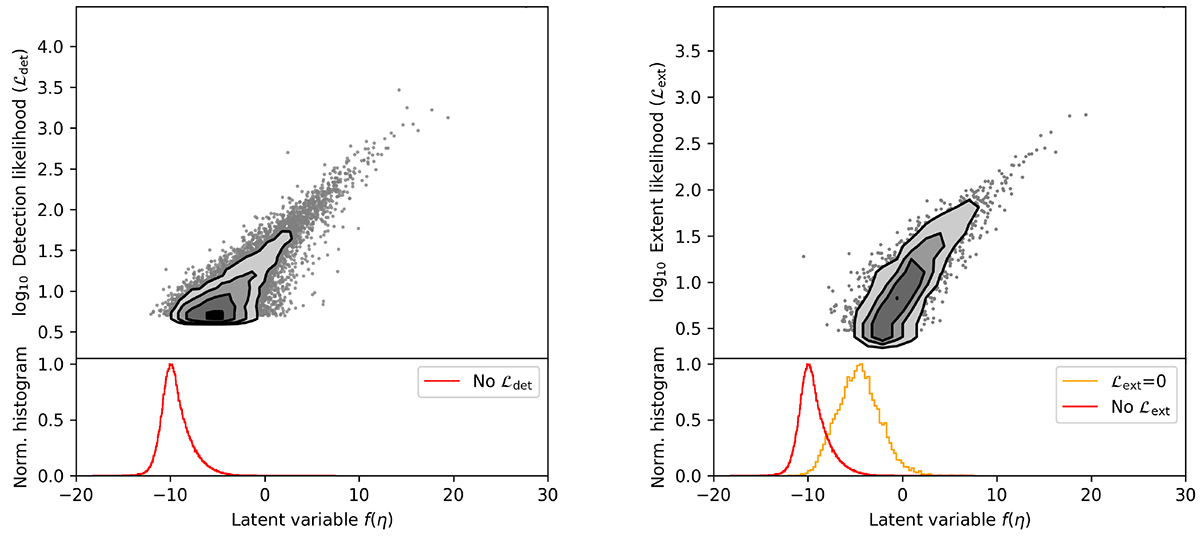
Fig. 26.
Download original image
Relation between the latent variable f(η) = w0 + ∑jwjηj calculated for each simulated cluster in the test sample after performing logistic regression with 35 surface brightness features, and the values of ℒdet and ℒext as provided by eSASS for those matched to a detection. Each dot stands for a simulated cluster, density contours ease visualisation in crowded regions. Undetected clusters have no associated ℒdet value (red histogram in the lower panel). Clusters detected but not categorised as extended have zero value for ℒext (orange histogram). The apparent correlation between f and both measurements indicate that the model has “discovered” the importance of ℒdet and ℒext in the selection process.
Current usage metrics show cumulative count of Article Views (full-text article views including HTML views, PDF and ePub downloads, according to the available data) and Abstracts Views on Vision4Press platform.
Data correspond to usage on the plateform after 2015. The current usage metrics is available 48-96 hours after online publication and is updated daily on week days.
Initial download of the metrics may take a while.