Fig. 20.
Download original image
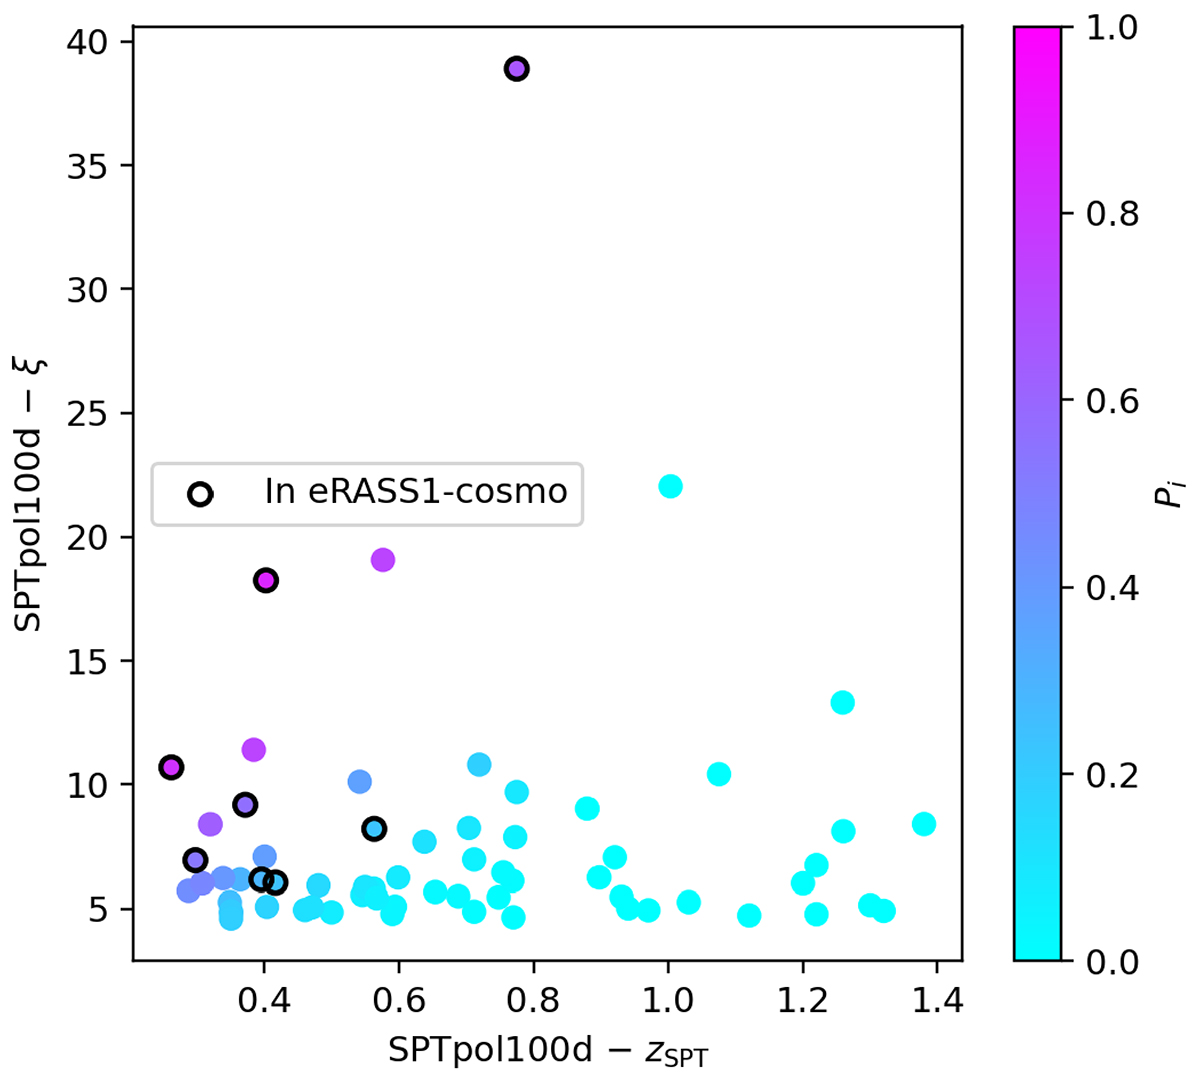
Similar to Fig. 15, but using the cosmology sample of eRASS1 clusters as a test sample, and the SPTpol-100d catalogue as a reference sample (65 objects at z > 0.25, coloured dots). The vertical axis represents the column xi in the SPTpol catalogue, standing for the measured cluster signal-to-noise (unitless). The horizontal axis represents the measured redshift in the SPT catalogue. The model predicts only a handful of eRASS1 detections among those objects, consistently with the observed number of 8 matches.
Current usage metrics show cumulative count of Article Views (full-text article views including HTML views, PDF and ePub downloads, according to the available data) and Abstracts Views on Vision4Press platform.
Data correspond to usage on the plateform after 2015. The current usage metrics is available 48-96 hours after online publication and is updated daily on week days.
Initial download of the metrics may take a while.