Fig. 19.
Download original image
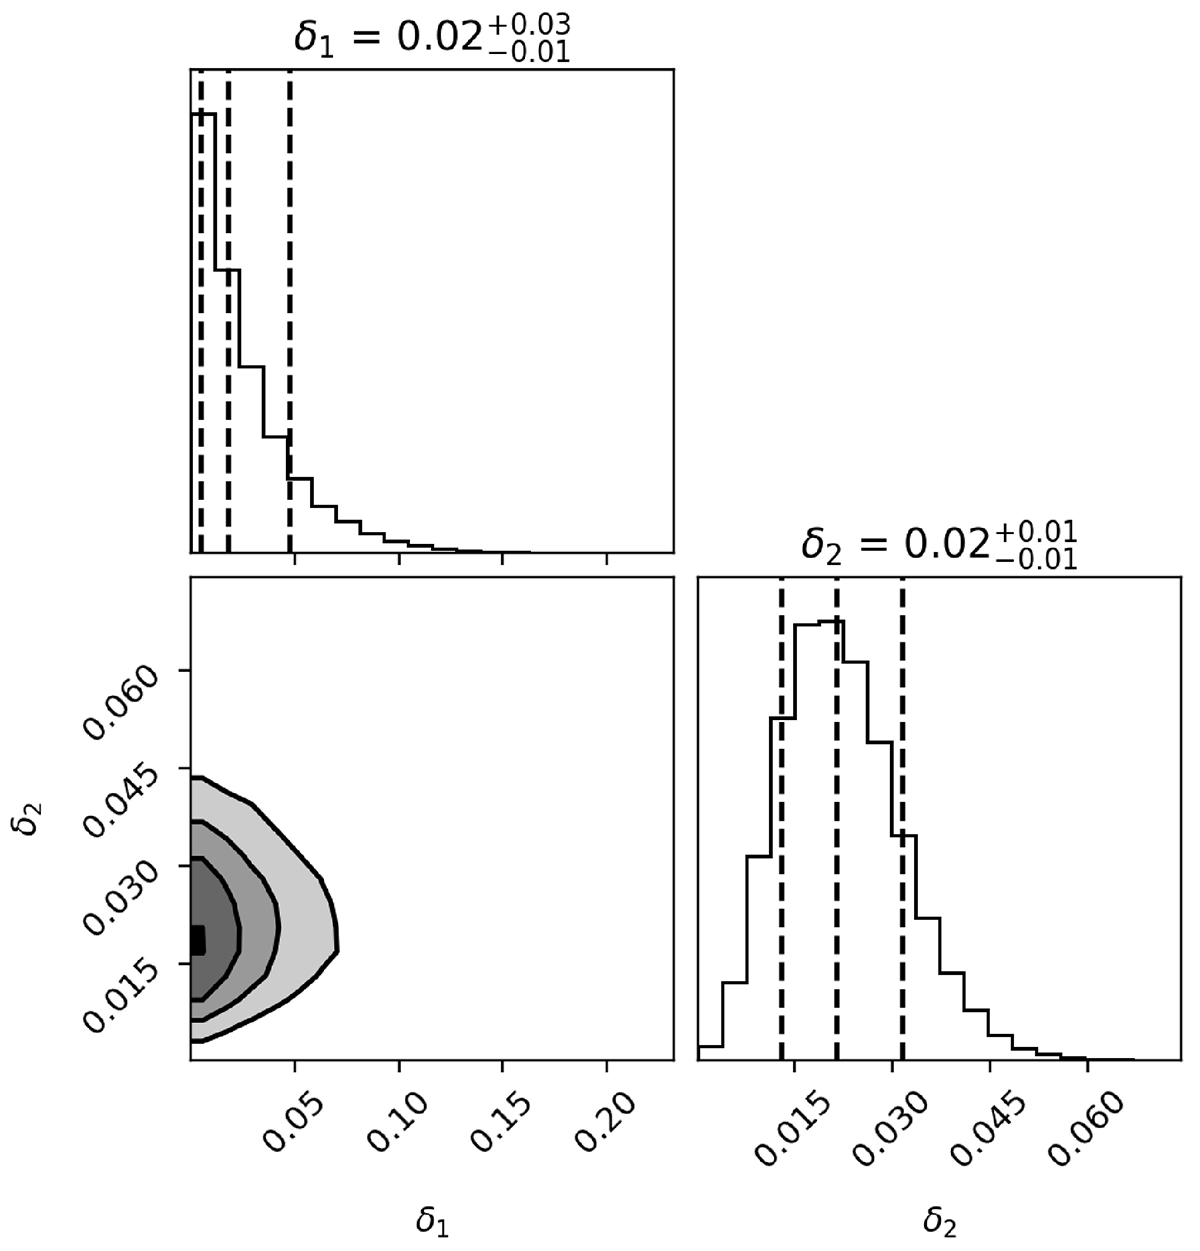
Posterior distribution for the pair of parameters (δ1 and δ2) introduced in Eq. (9), for the experiment using eRASS1-main as a test and eFEDS as a reference sample. The histograms represent the marginalised posterior distributions, with mean and 68% range overprinted. The contours represent the equivalent 0.5-, 1-, 1.5- and 2-σ distribution of the joint posterior. Clearly the parameter δ2 departs from zero, indicating that a fraction of the systems we predict not be detected leak into the actual eRASS1 sample.
Current usage metrics show cumulative count of Article Views (full-text article views including HTML views, PDF and ePub downloads, according to the available data) and Abstracts Views on Vision4Press platform.
Data correspond to usage on the plateform after 2015. The current usage metrics is available 48-96 hours after online publication and is updated daily on week days.
Initial download of the metrics may take a while.