Fig. 17.
Download original image
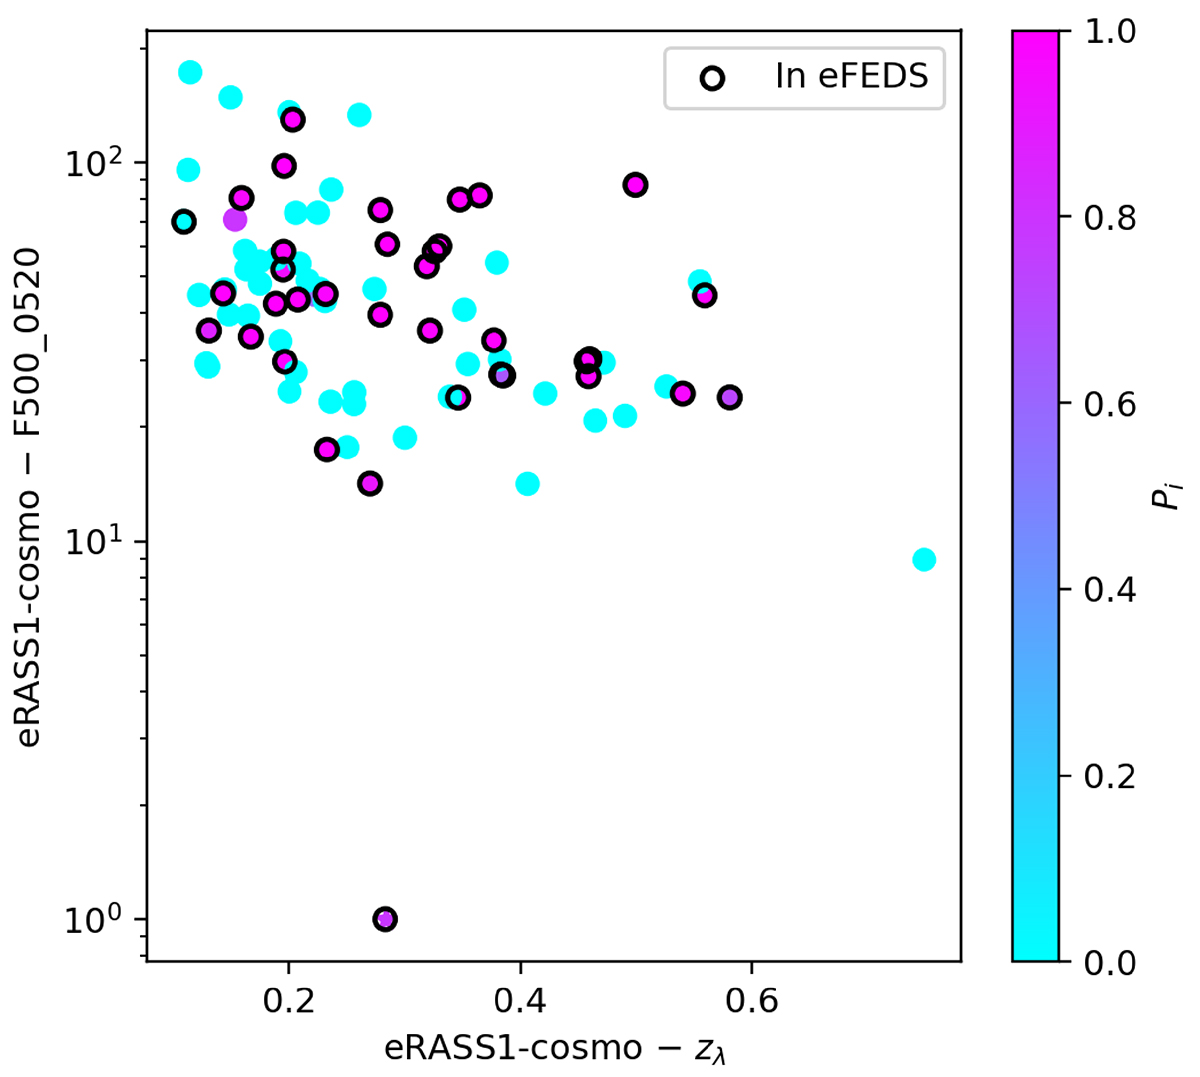
Similar to Fig. 15, but now taking eRASS1-cosmo as the reference sample (85 entries) and eFEDS as the test sample. The vertical axis represents F500_0520, the 0.5–2 keV flux within R500 reported in the eRASS1 catalogue (units 10−14 erg s−1 cm−2). The horizontal axis is the catalogue redshift zλ. Clusters falling in zones of zero eFEDS exposure have vanishing probability (Pi = 0). Other eRASS1 clusters are very likely to be detected in eFEDS (Pi ≃ 1); in fact they are, as shown by the black circles. The isolated point at the bottom of the figure only has a flux upper limit 1.5 × 10⁻¹³ erg s−1 cm−2.
Current usage metrics show cumulative count of Article Views (full-text article views including HTML views, PDF and ePub downloads, according to the available data) and Abstracts Views on Vision4Press platform.
Data correspond to usage on the plateform after 2015. The current usage metrics is available 48-96 hours after online publication and is updated daily on week days.
Initial download of the metrics may take a while.