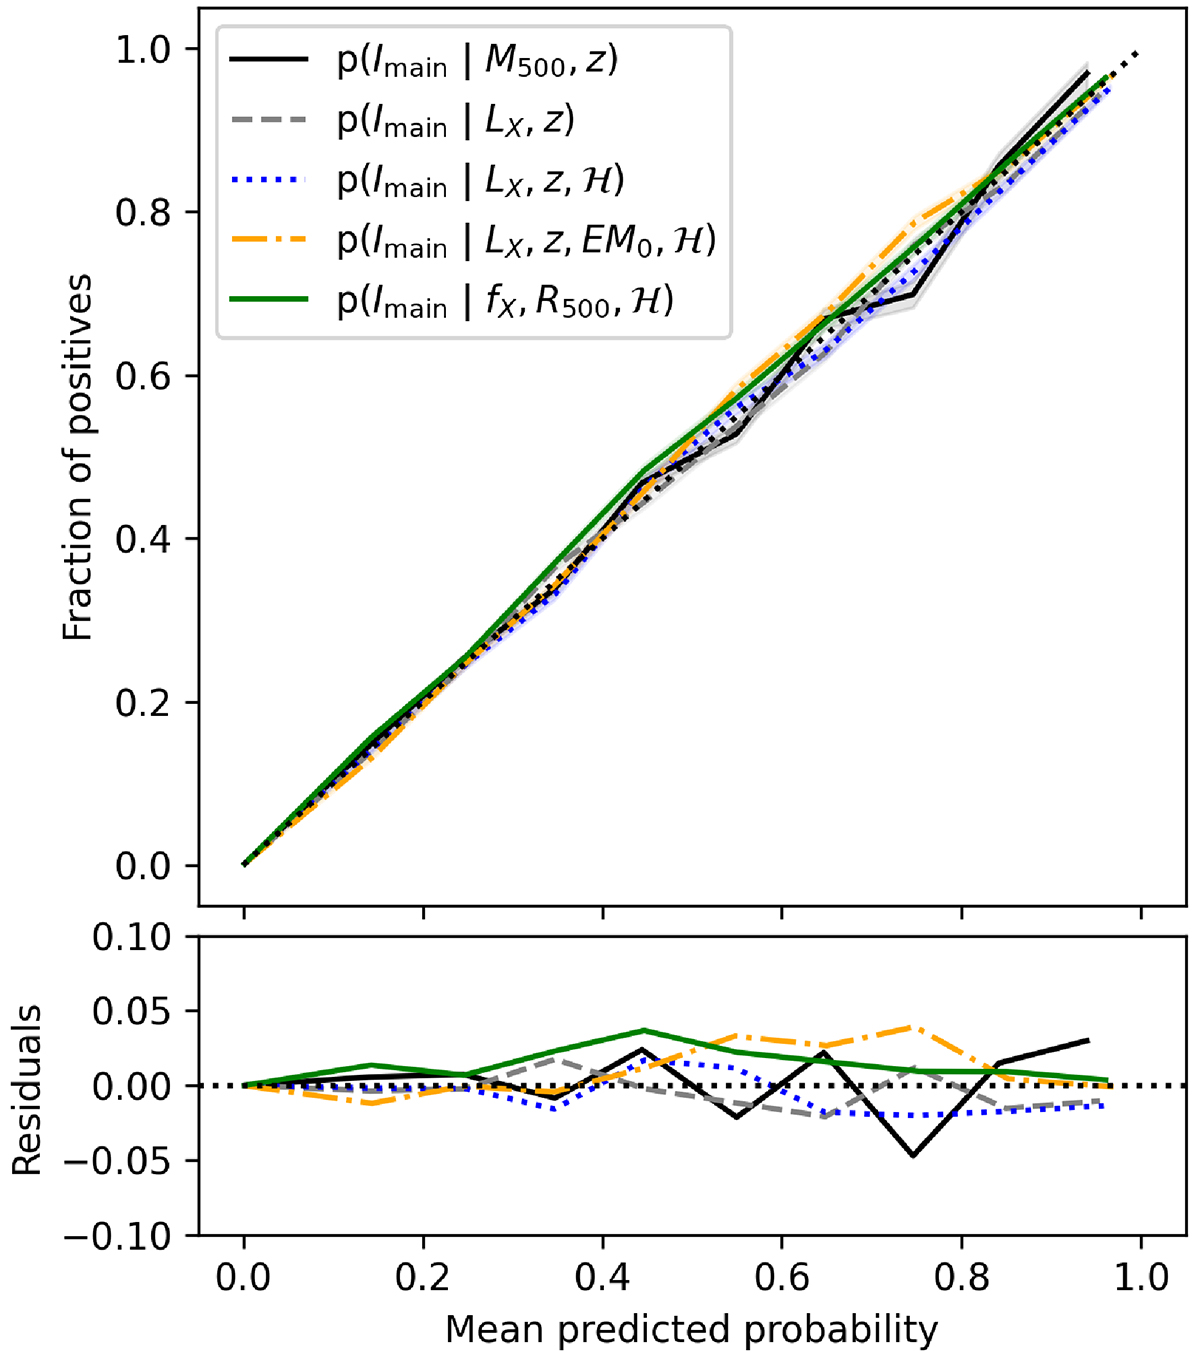
Fig. 13.
Download original image
Evaluating the reliability of five models predicting the probability of a cluster to appear in the eRASS1 primary cluster catalogue (x-axis). The y-axis represents the actual fraction of selected objects in the test sample. The bottom panel shows the residuals (difference) of each curve with respect to the one-to-one line. Shaded regions indicate 68% confidence intervals in each bin of probability.
Current usage metrics show cumulative count of Article Views (full-text article views including HTML views, PDF and ePub downloads, according to the available data) and Abstracts Views on Vision4Press platform.
Data correspond to usage on the plateform after 2015. The current usage metrics is available 48-96 hours after online publication and is updated daily on week days.
Initial download of the metrics may take a while.