Open Access
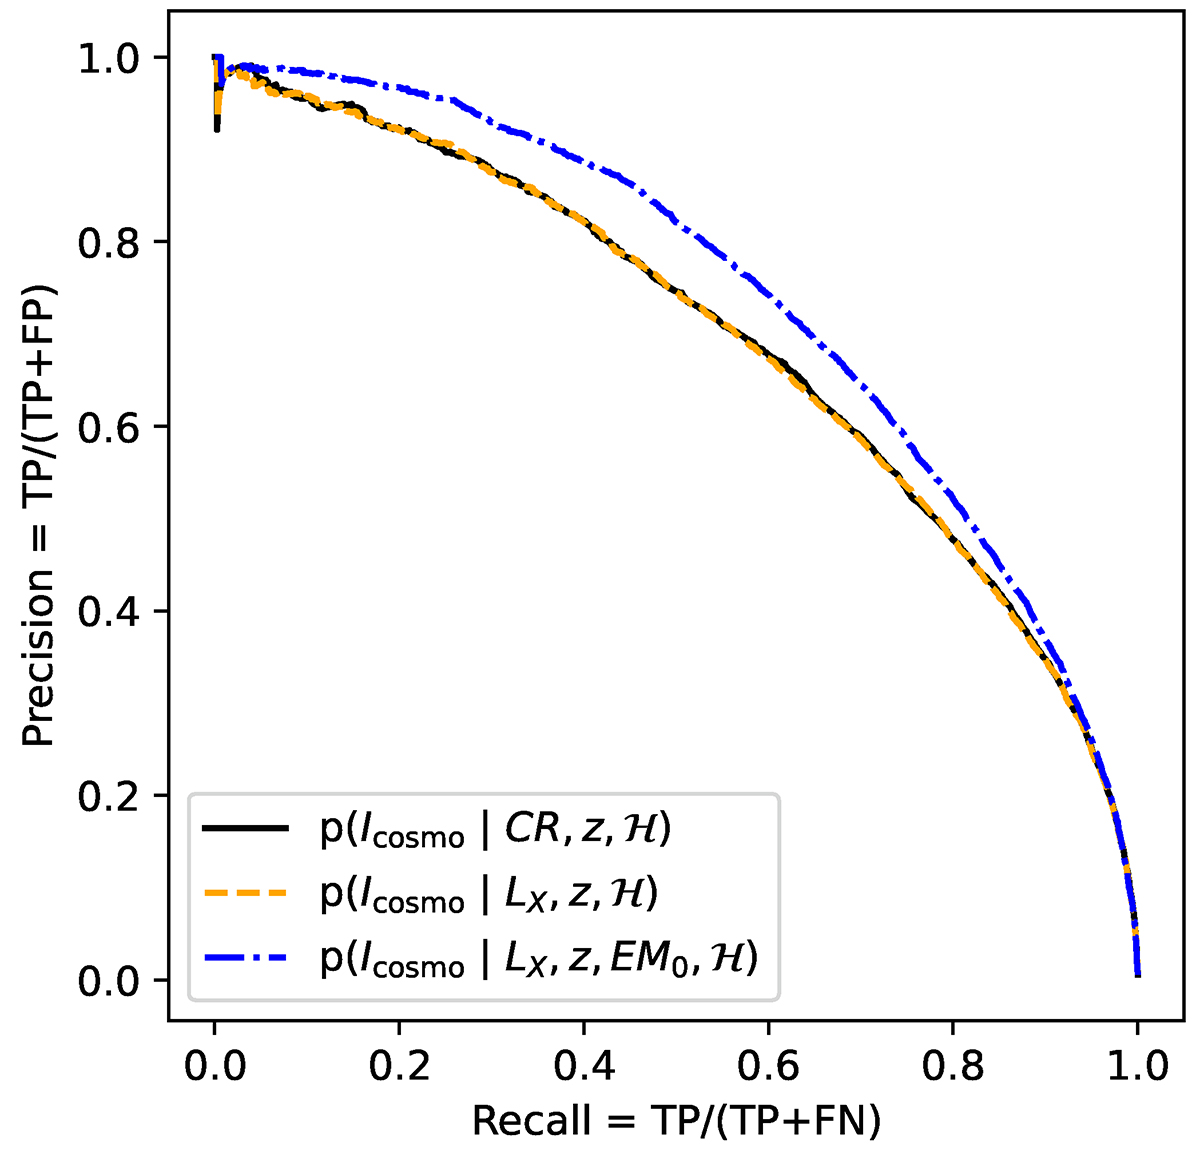
Fig. 12.
Download original image
Similar to Fig. 11, but comparing three models predicting the presence of a cluster in the cosmology. The model represented with the black curve corresponds to the baseline selection model used in the analysis of Ghirardini et al. (2024).
Current usage metrics show cumulative count of Article Views (full-text article views including HTML views, PDF and ePub downloads, according to the available data) and Abstracts Views on Vision4Press platform.
Data correspond to usage on the plateform after 2015. The current usage metrics is available 48-96 hours after online publication and is updated daily on week days.
Initial download of the metrics may take a while.