Fig. 9.
Download original image
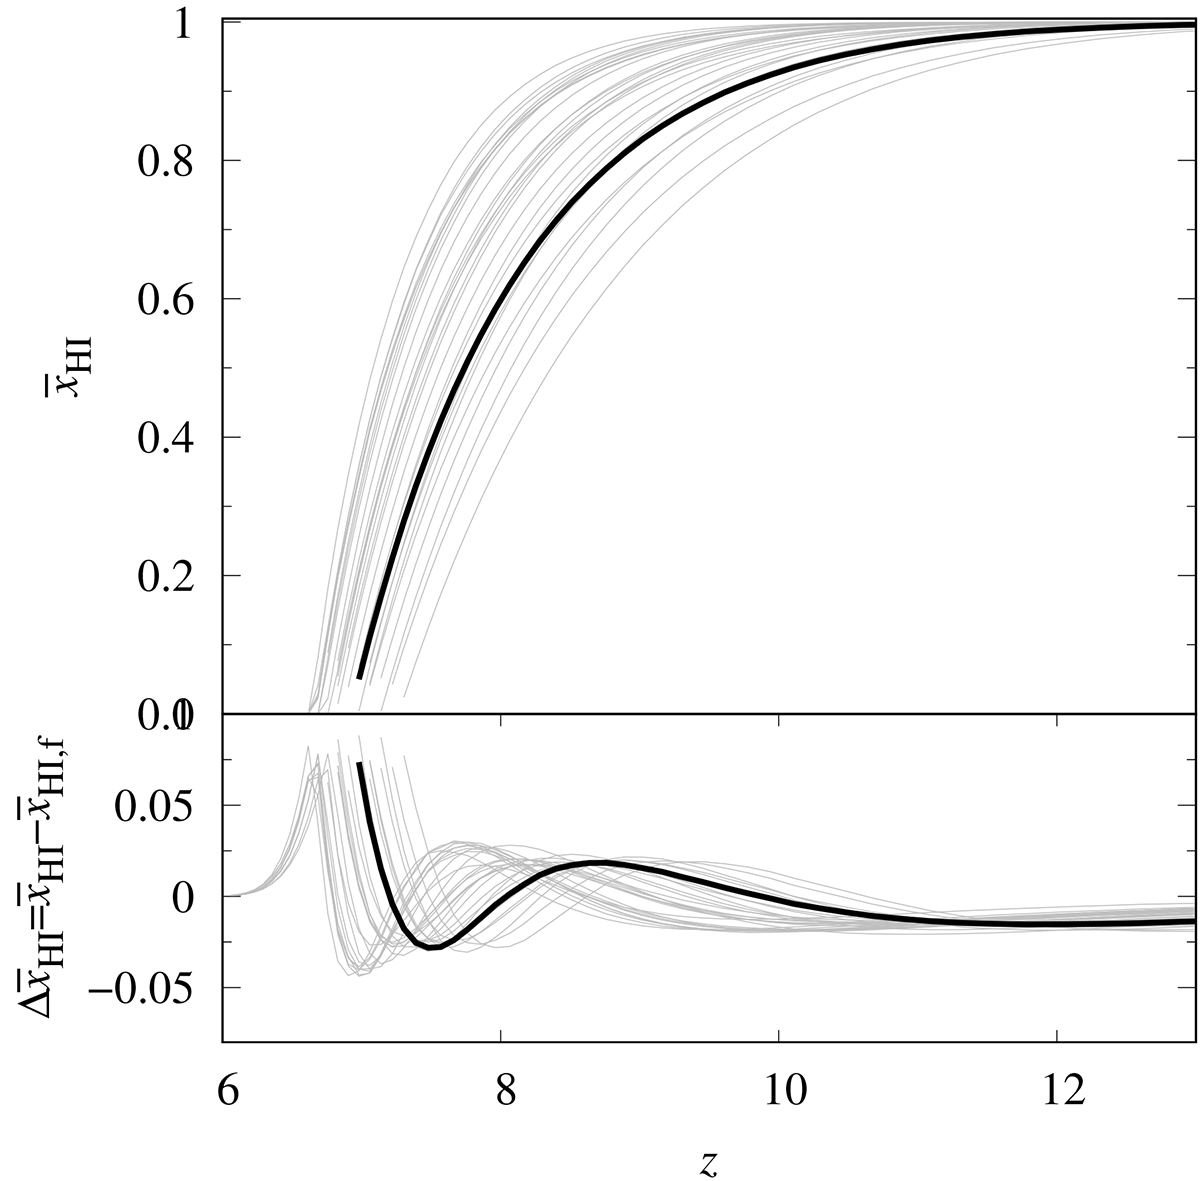
Modeling of reionization history ![]() using Eq. (6). The top panel shows the evolution of the neutral fraction as a function of redshift for different reionization scenarios generated using GRIZZLY code. The bold black curve corresponds to our GRIZZLY fiducial reionization scenario. The bottom panel shows fitting error
using Eq. (6). The top panel shows the evolution of the neutral fraction as a function of redshift for different reionization scenarios generated using GRIZZLY code. The bold black curve corresponds to our GRIZZLY fiducial reionization scenario. The bottom panel shows fitting error ![]() on the redshift evolution of
on the redshift evolution of ![]() . We have used an asymmetric tanh function (see Eq. (6)) to model the redshift evolution of
. We have used an asymmetric tanh function (see Eq. (6)) to model the redshift evolution of ![]() .
.
Current usage metrics show cumulative count of Article Views (full-text article views including HTML views, PDF and ePub downloads, according to the available data) and Abstracts Views on Vision4Press platform.
Data correspond to usage on the plateform after 2015. The current usage metrics is available 48-96 hours after online publication and is updated daily on week days.
Initial download of the metrics may take a while.