Fig. 7.
Download original image
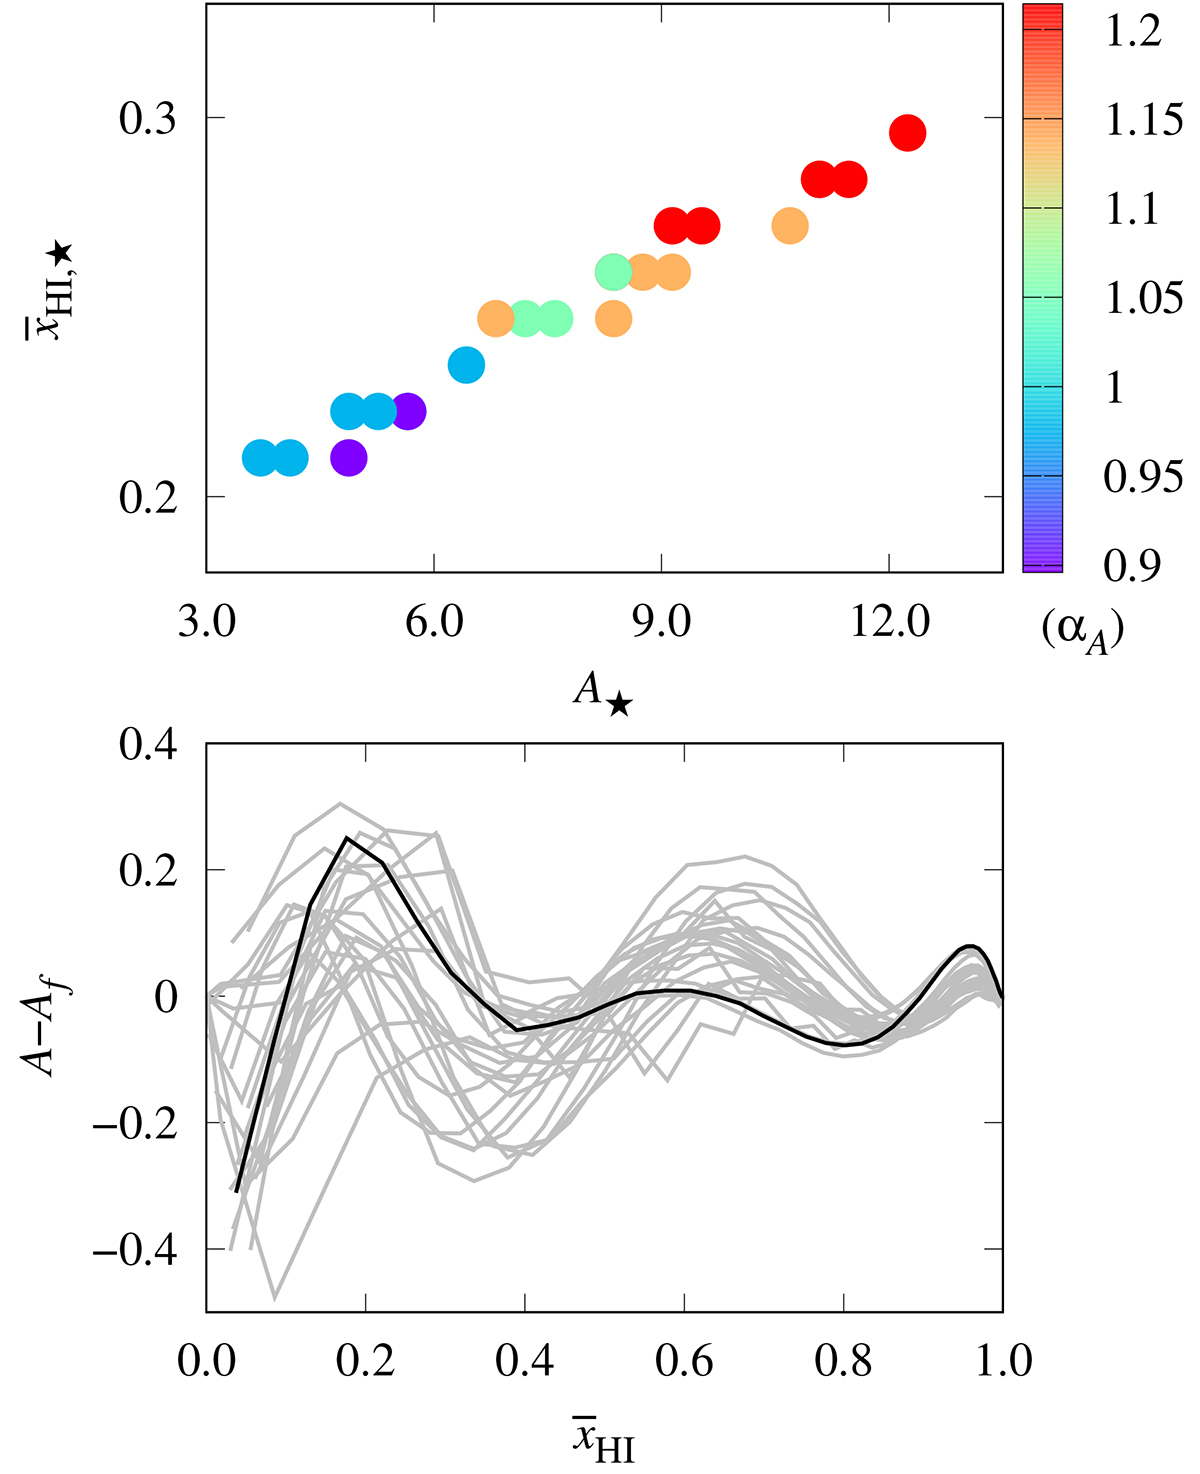
Results of fitting the dependence of A on ![]() using Eq. (4). Top panel shows the best-fit values of the parameters A⋆,
using Eq. (4). Top panel shows the best-fit values of the parameters A⋆, ![]() and αA when we fit different curves of the left panel of Fig. 5 using Eq. (4). Here, A represents the ratio
and αA when we fit different curves of the left panel of Fig. 5 using Eq. (4). Here, A represents the ratio ![]() at k ∼ 0.05 h Mpc−1. The bottom panel shows the difference between the input/true A values and predicted (or fitted) Af values with the best-fit parameters as a function of average ionization fraction
at k ∼ 0.05 h Mpc−1. The bottom panel shows the difference between the input/true A values and predicted (or fitted) Af values with the best-fit parameters as a function of average ionization fraction ![]() .
.
Current usage metrics show cumulative count of Article Views (full-text article views including HTML views, PDF and ePub downloads, according to the available data) and Abstracts Views on Vision4Press platform.
Data correspond to usage on the plateform after 2015. The current usage metrics is available 48-96 hours after online publication and is updated daily on week days.
Initial download of the metrics may take a while.