Fig. 5.
Download original image
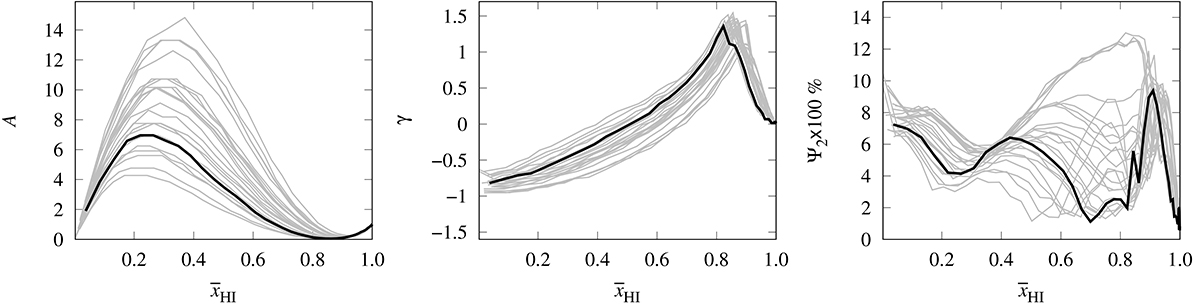
Outcome of fitting EoR power spectra using Eq. (3). Left to right panels show the evolution of the best-fit values of the parameters A and γ and fitting error as a function of ![]() for different reionization scenarios. It should be noted that here we have used Eq. (3) while we used Eq. (2) for Fig. 4. The reionization scenarios are the same as in Fig. 4. Bold lines correspond to the fiducial GRIZZLY reionization scenario.
for different reionization scenarios. It should be noted that here we have used Eq. (3) while we used Eq. (2) for Fig. 4. The reionization scenarios are the same as in Fig. 4. Bold lines correspond to the fiducial GRIZZLY reionization scenario.
Current usage metrics show cumulative count of Article Views (full-text article views including HTML views, PDF and ePub downloads, according to the available data) and Abstracts Views on Vision4Press platform.
Data correspond to usage on the plateform after 2015. The current usage metrics is available 48-96 hours after online publication and is updated daily on week days.
Initial download of the metrics may take a while.