Fig. 3.
Download original image
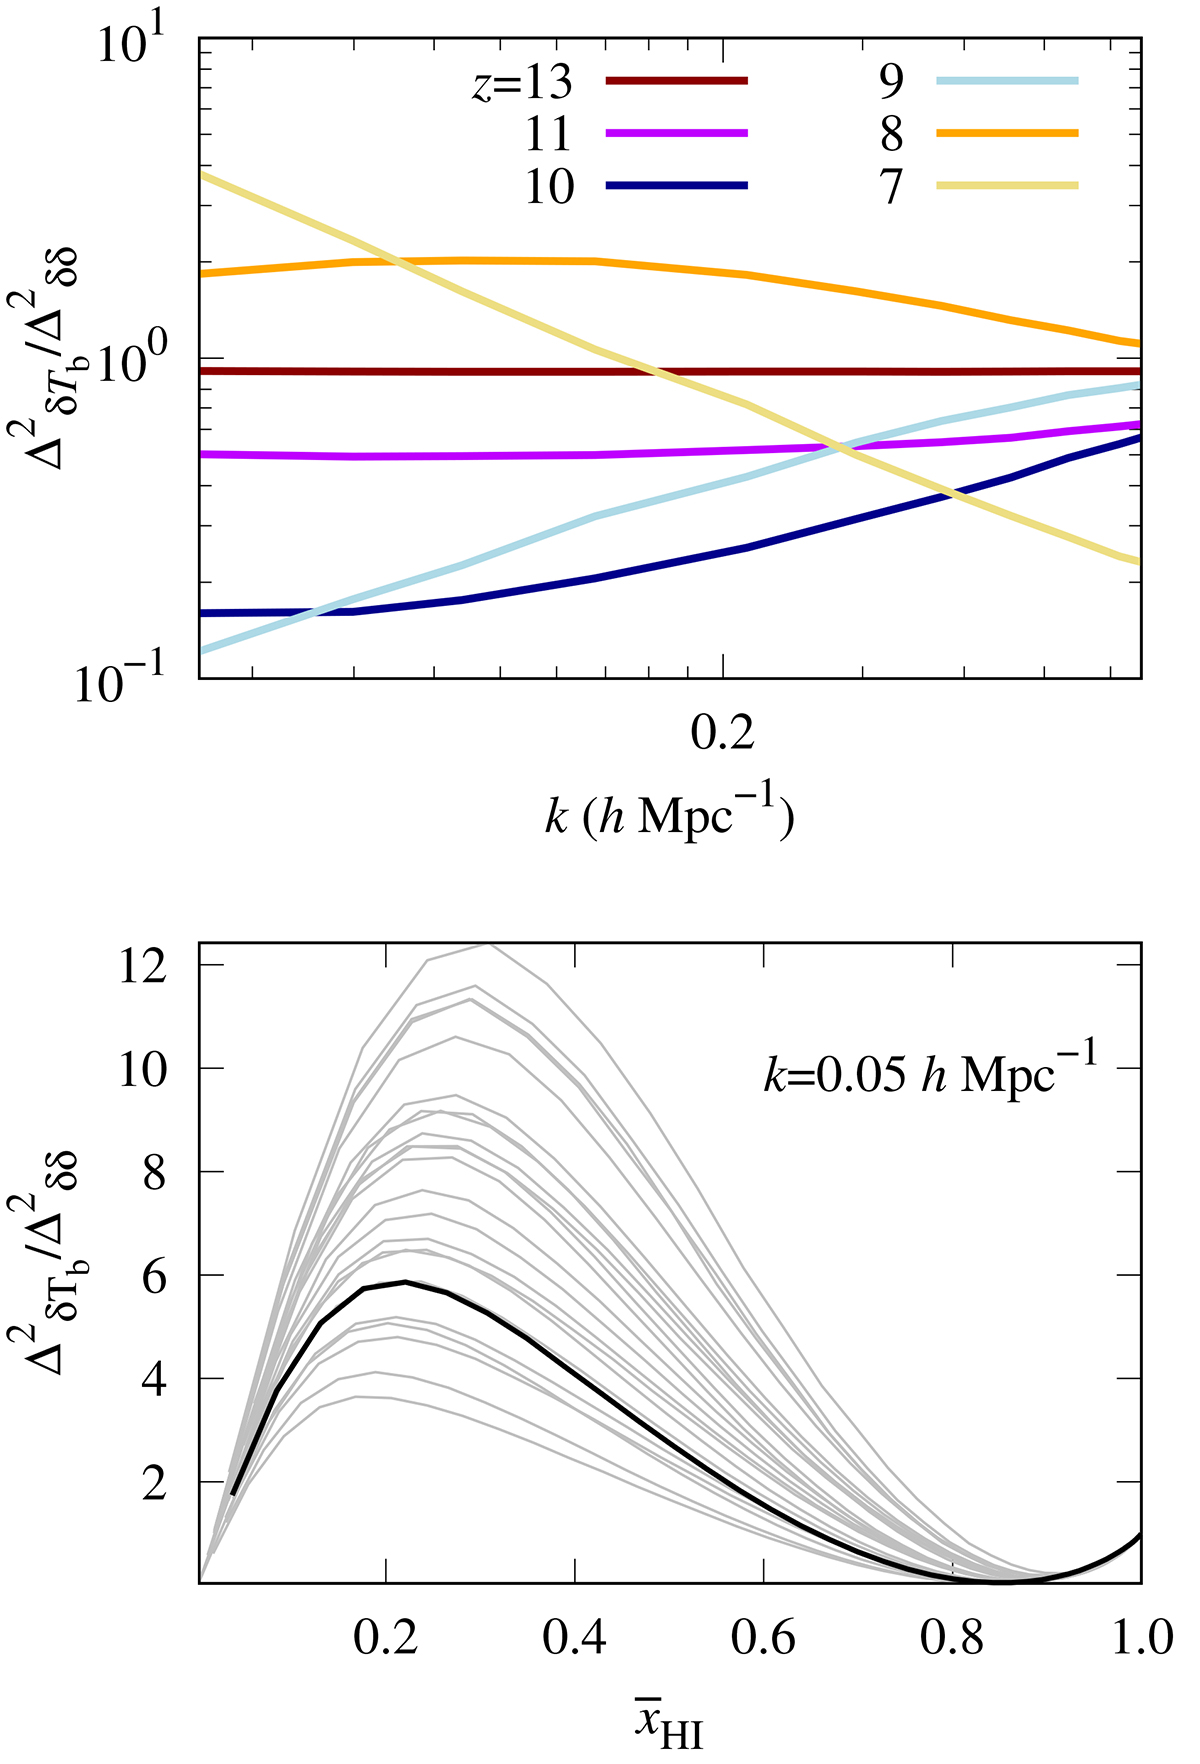
Ratio of ![]() to
to ![]() obtained from simulations during EoR. The top panel shows
obtained from simulations during EoR. The top panel shows ![]() as a function of k at different redshifts. These correspond to our fiducial GRIZZLY model which is also shown in Fig. 2. The bottom panel shows evolution of
as a function of k at different redshifts. These correspond to our fiducial GRIZZLY model which is also shown in Fig. 2. The bottom panel shows evolution of ![]() at k = 0.05 h Mpc−1 as a function of neutral fraction. Different curves stand for different reionization scenarios generated using GRIZZLY by varying αS and Mmin. The black curve represents our fiducial GRIZZLY simulation which corresponds to αS = 1 and Mmin = 109 M⊙.
at k = 0.05 h Mpc−1 as a function of neutral fraction. Different curves stand for different reionization scenarios generated using GRIZZLY by varying αS and Mmin. The black curve represents our fiducial GRIZZLY simulation which corresponds to αS = 1 and Mmin = 109 M⊙.
Current usage metrics show cumulative count of Article Views (full-text article views including HTML views, PDF and ePub downloads, according to the available data) and Abstracts Views on Vision4Press platform.
Data correspond to usage on the plateform after 2015. The current usage metrics is available 48-96 hours after online publication and is updated daily on week days.
Initial download of the metrics may take a while.