Fig. 2.
Download original image
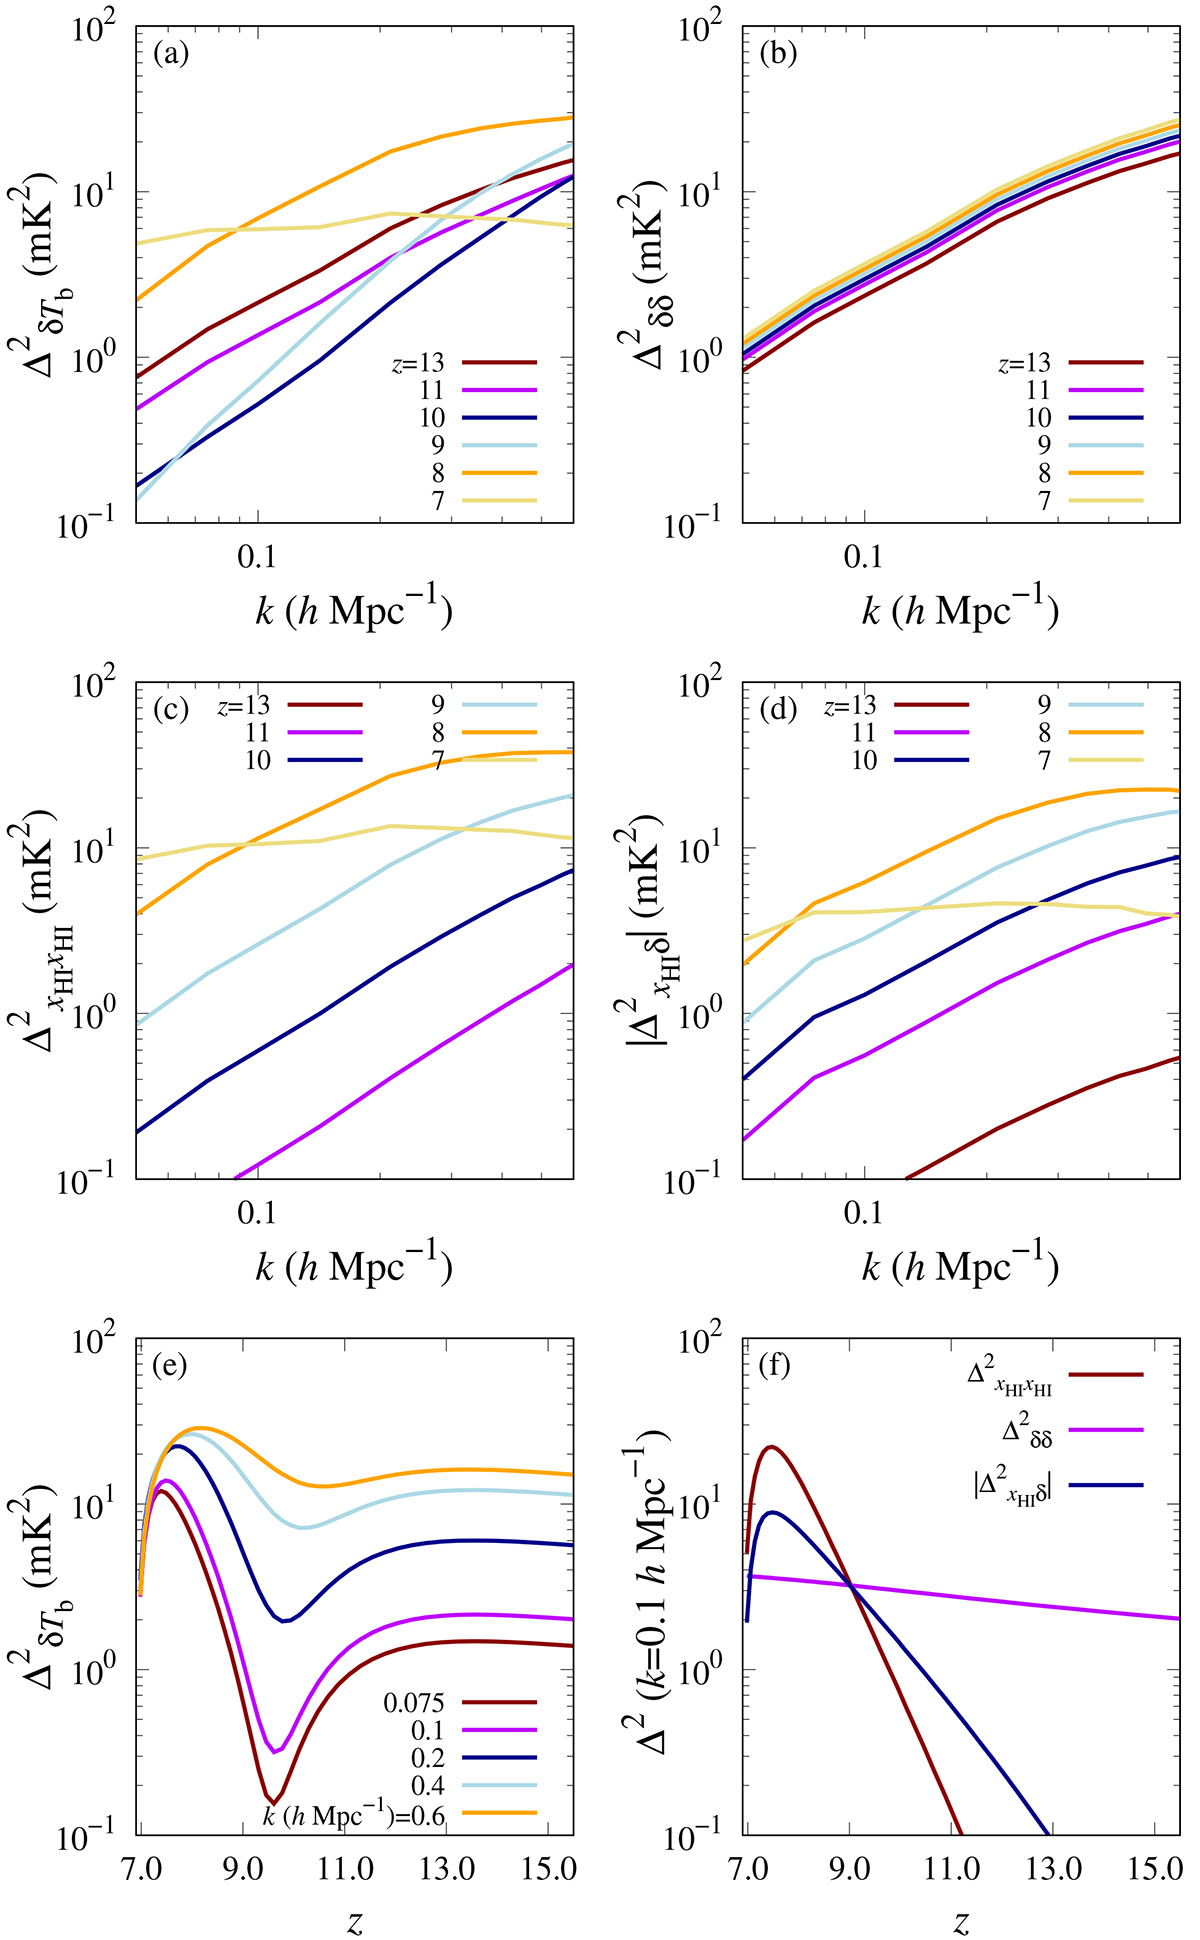
Power spectra of EoR 21 cm signal brightness temperature and their different components. The a–d panels show ![]() ,
, ![]() , and
, and ![]() respectively as a function of k at different stages of reionization. The e panel shows the redshift evolution of the 21 cm power spectrum at different scales. The f panel compares the redshift evolution of
respectively as a function of k at different stages of reionization. The e panel shows the redshift evolution of the 21 cm power spectrum at different scales. The f panel compares the redshift evolution of ![]() , and
, and ![]() at k = 0.1 h Mpc−1. The power spectra correspond to our fiducial GRIZZLY EoR scenario as shown in Fig. 1.
at k = 0.1 h Mpc−1. The power spectra correspond to our fiducial GRIZZLY EoR scenario as shown in Fig. 1.
Current usage metrics show cumulative count of Article Views (full-text article views including HTML views, PDF and ePub downloads, according to the available data) and Abstracts Views on Vision4Press platform.
Data correspond to usage on the plateform after 2015. The current usage metrics is available 48-96 hours after online publication and is updated daily on week days.
Initial download of the metrics may take a while.