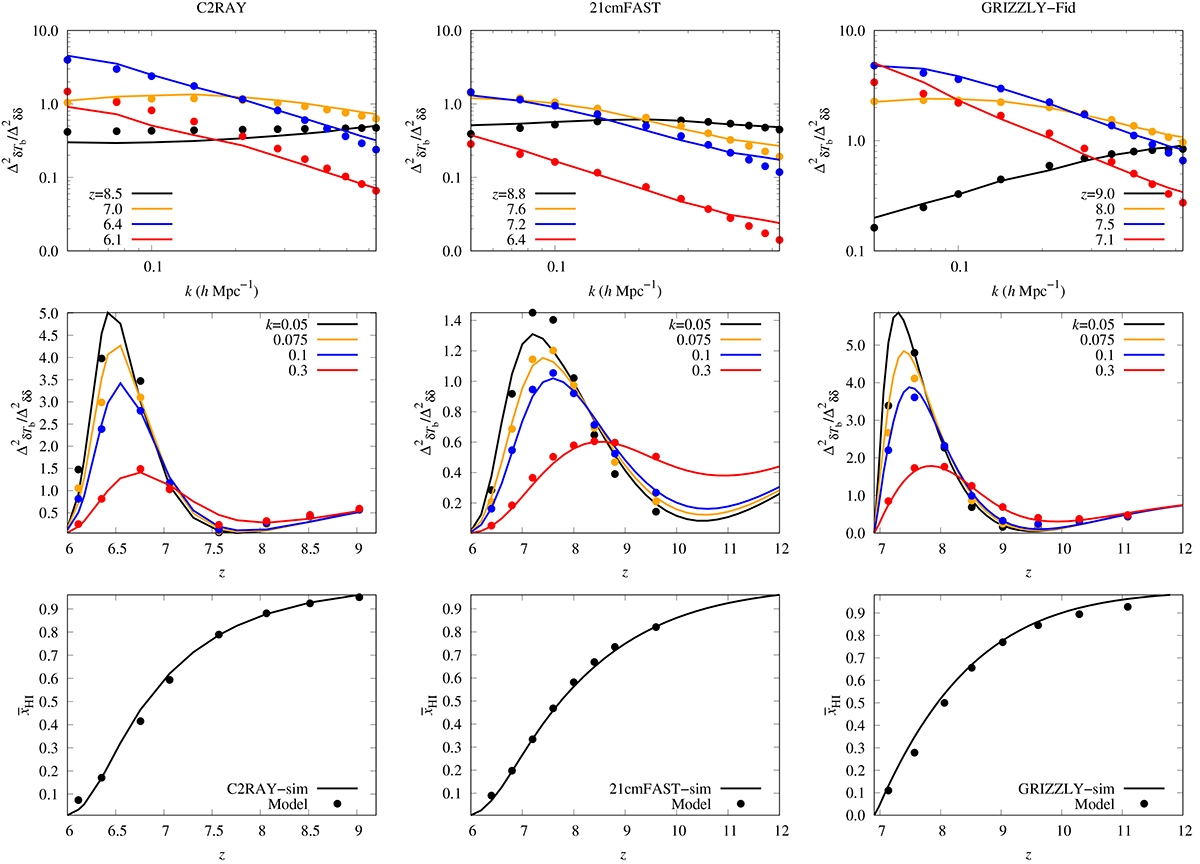
Fig. 12.
Download original image
Comparison between the input reionization scenario and recovered model from the MCMC analysis using EoR power spectra as input to the phenomenological model considered in this work. Left to right columns represent C2RAY, 21CMFAST, and GRIZZLY simulation respectively. From top to bottom we show, respectively, the ratio of 21 cm signal to density power spectrum (![]() ) as a function of k-scales at different redshifts, the redshift evolution of
) as a function of k-scales at different redshifts, the redshift evolution of ![]() for different scales and the corresponding reionization histories. The solid curves represent the inputs from simulations while the dotted curves stand for the MCMC best-fit prediction on the power spectrum model used in this work.
for different scales and the corresponding reionization histories. The solid curves represent the inputs from simulations while the dotted curves stand for the MCMC best-fit prediction on the power spectrum model used in this work.
Current usage metrics show cumulative count of Article Views (full-text article views including HTML views, PDF and ePub downloads, according to the available data) and Abstracts Views on Vision4Press platform.
Data correspond to usage on the plateform after 2015. The current usage metrics is available 48-96 hours after online publication and is updated daily on week days.
Initial download of the metrics may take a while.