| Issue |
A&A
Volume 687, July 2024
|
|
|---|---|---|
| Article Number | A29 | |
| Number of page(s) | 9 | |
| Section | Interstellar and circumstellar matter | |
| DOI | https://doi.org/10.1051/0004-6361/202449429 | |
| Published online | 26 June 2024 | |
First detection of CF+ in the Large Magellanic Cloud
1
Max-Planck-Institut für Radioastronomie,
Auf dem Hügel 69,
53121
Bonn, Germany
e-mail: ygong@mpifr-bonn.mpg.de
2
Purple Mountain Observatory, and Key Laboratory of Radio Astronomy, Chinese Academy of Sciences,
10 Yuanhua Road,
Nanjing
210023, PR China
e-mail: ygong@pmo.ac.cn
3
William H. Miller III Department of Physics & Astronomy, Johns Hopkins University,
3400 North Charles Street,
Baltimore, MD
21218, USA
Received:
31
January
2024
Accepted:
7
May
2024
Context. CF+ has been established as a valuable diagnostic tool for investigating photodissociation regions (PDRs) and fluorine abundances in the Milky Way. However, its role in extragalactic environments remains largely uncharted.
Aims. Our objective is to explore the significance of CF+ in the Large Magellanic Cloud (LMC) and assess its utility as a probe for examining C+ and fluorine abundances in external galaxies.
Methods. We performed pointed CF+ observations toward an active star-forming region, N113 in the LMC, using the Atacama Pathfinder EXperiment 12 m submillimeter telescope.
Results. We report the first discovery of CF+ in the LMC through the successful detection of the CF+ (2→1) and (3→2) lines. The excitation models indicate that CF+ emission originates from dense PDRs characterized by an H2 number density of (0.5–7.9) × 104 cm−3 in N113. Our observations provide the first constraint on the fluorine abundance in molecular clouds in the LMC, ≲1.7 × 10⁻⁹. This value is about an order of magnitude lower than those previously measured toward red giants in the LMC, indicative of fluorine deficiency in the molecular gas. The estimated column density ratio between C+ and CF+ appears to be lower than the anticipated equilibrium ratio derived from the fluorine abundance in red giants. Both phenomena can be explained by the deficiency of CF+ caused by the freeze-out of its primary chemical precursor, HF, onto dust grains.
Conclusions. The deficiency of CF+ within molecular clouds suggests that the measurements presented in this work serve exclusively as conservative estimates, establishing lower bounds for both the fluorine abundance and C+ column densities in external galaxies.
Key words: ISM: molecules / galaxies: ISM / Magellanic Clouds / radio lines: ISM / ISM: individual objects: N113
© The Authors 2024
 Open Access article, published by EDP Sciences, under the terms of the Creative Commons Attribution License (https://creativecommons.org/licenses/by/4.0), which permits unrestricted use, distribution, and reproduction in any medium, provided the original work is properly cited.
This article is published in open access under the Subscribe to Open model.
Open Access funding provided by Max Planck Society.
1 Introduction
The abundances of both ionized carbon, C+, and fluorine are important parameters for understanding the life cycle of matter in galaxies. The far-infrared fine-structure line of C+ at ~ 158 µm (hereafter, [CII]) stands as one of the most crucial coolants in the Universe (e.g., Wolfire et al. 2003; Draine 2011), and serves as a powerful tracer of star formation rates (Herrera-Camus et al. 2015), CO-dark gas (e.g., Wolfire et al. 2010; Pineda et al. 2013; Langer et al. 2014), and photodissociation regions (PDRs; Hollenbach & Tielens 1999; Wolfire et al. 2022). In parallel, the fluorine abundance can yield valuable insights into the stellar nucleosynthesis history and chemical enrichment of a region (e.g., Cunha et al. 2003; Franco et al. 2021). Assessments of the fluorine abundance within molecular clouds have predominantly relied on the analysis of infrared and submillimeter spectra of the hydrogen fluoride molecule HF (e.g., Neufeld et al. 1997, 2010). Because HF is the only neutral diatomic hydride that can be produced by an exothermic reaction with H2 (e.g., Neufeld & Wolfire 2009; Gerin et al. 2016), HF data can be used as a proxy to determine H2 column densities of CO-dark molecular gas (e.g., Kavak et al. 2019). However, the rest frequencies of the [CII] and HF rotational transitions are presently inaccessible for observations due to absorption by the Earth’s atmosphere, since facilities such as the Herschel Space Observatory and the Stratospheric Observatory for Infrared Astronomy (SOFIA), which were previously employed for investigating lines from both species, are no longer operational. Consequently, there arises a need for alternative tracers that can be readily observed using ground-based telescopes, and thus afford additional insights into C+ and fluorine abundances within the interstellar medium (ISM).
CF+ is the second most abundant fluorine-bearing molecule in space after HF (e.g., Neufeld et al. 2005, 2006). Based on the fluorine chemical network, it has been suggested that CF+ primarily forms through the reaction C++HF→CF++H (Neufeld et al. 2005; Dagdigian et al. 2019). Consequently, CF+ is expected to be produced in PDRs where C+ and HF are abundant (e.g., Neufeld et al. 2006). Therefore, CF+ can serve as a proxy for C+ and HF, which is supported by previous observations (e.g., Guzmán et al. 2012a).
Since its first detection in the Orion Bar, an archetypal dense PDR (Neufeld et al. 2006), CF+ has been widely detected in various Galactic regions, including other dense PDRs (Guzmán et al. 2012b,a; Nagy et al. 2013, 2017), high-mass star formation regions (Kalenskii & Johansson 2010a,b; Fechtenbaum et al. 2015; Liszt et al. 2015), and diffuse molecular clouds against bright background continuum sources (Liszt et al. 2014, 2015; Gerin et al. 2019). Recent imaging observations of CF+ (2→1) have revealed its extended distribution in Orion A (Brinkmann et al. 2020). However, extragalactic studies of CF+ have remained limited, primarily due to its weak intensities, with only one report of the CF+ (2←1) line in absorption, along the line of sight toward the gravitationally lensed system PKS 1830−211 at a redshift z = 0.89 (Muller et al. 2016). Hence, extragalactic CF+ has remained largely unexplored. This raises the question of whether CF+ can serve as a reliable probe for C+ and fluorine abundances in external galaxies.
At a distance of 50 kpc (Pietrzyński et al. 2019), the Large Magellanic Cloud (LMC) stands out as one of the nearest metal-poor galaxies. Widespread bright [CII] emission from the LMC’s ISM has been found (e.g., Israel et al. 1996; Okada et al. 2019a; Oliveira et al. 2019; Lebouteiller et al. 2019) with elevated C+-to-CO ratios (Poglitsch et al. 1995). As to fluorine, observations of the 2.3 µm near-infrared absorption band from HF have yielded fluorine abundances for a sample of red giants in the LMC (Cunha et al. 2003), while fluorine in the system’s ISM remains unconstrained. These findings motivate searches for CF+. Within the LMC, N113 emerges as a prominent site of active massive star formation, characterized by prolific molecular line emissions (Chin et al. 1997; Heikkila et al. 1998; Wang et al. 2009; Paron et al. 2014; Nishimura et al. 2016; Sewiło et al. 2018), the presence of OH and H2O masers (Brooks & Whiteoak 1997; Ellingsen et al. 2010; Imai et al. 2013), and numerous young stellar objects (e.g., Gruendl & Chu 2009; Sewiło et al. 2010; Carlson et al. 2012). Moreover, N113 ranks among the brightest [CII] emitters within the LMC (Oliveira et al. 2019), making it an exceptional candidate for the quest to detect CF+. Therefore, we undertook dedicated observations of CF+ toward N113, aiming to assess its role in the LMC’s interstellar chemistry and as a tracer of C+.
We describe our observations in Sect. 2 and report our results in Sect. 3. These findings are discussed in Sect. 4. We conclude with a summary in Sect. 5.
2 Observations and data reduction
On 2023 June 18–22 and August 22–26, targeted observations of N113 were conducted utilizing the Atacama Pathfinder Experiment (APEX) 12 m submillimeter telescope (Güsten et al. 2006) under project code: M9514C_111. For these observations, we employed the SEPIA1801 and SEPIA3452 receivers (Belitsky et al. 2018a,b; Meledin et al. 2022), equipped with an advanced generation fast Fourier transform spectrometer (FFTS; Klein et al. 2012), to observe the J = 2 → 1 and J = 3 → 2 transitions of CF+ at ~205.2 GHz and ~307.7 GHz, respectively (more accurate values are presented in Table 1). The SEPIA180 and SEPIA345 frequency configurations provided instantaneous intermediate frequency bandwidths of 8 GHz and 16 GHz, respectively. Data processing was facilitated by FFTSs, which encompassed the aforementioned intermediate frequency bandwidth using interconnected 4 GHz wide modules, each equipped with 65 536 channels. This configuration resulted in a channel width of 61 kHz, corresponding to ~0.09 and ~0.06 km s−1, respectively at 205.2 and 307.7 GHz, the rest frequencies of the CF+ transitions (see Table 1 for accurate values).
We conducted the observations using the APEX Control System (APECS) in the position-switching mode (Muders et al. 2006). Right ascension and declination of our target position are (αJ2000, δJ2000) =(05h13m 17S.40, –69º22′22.″0), which is the same as those used in Gong et al. (2023). Calibration was performed at intervals of roughly every five minutes. System temperatures were 101–159 K and 103–195 K on a  scale at 205 GHz and 307 GHz, respectively. We employed a main beam efficiency of 84% for both the J=2→1 and J=3→2 transitions according to pointing measurements toward Mars3, to establish the main beam brightness temperature scale. The half-power beam widths (HPBWs), θb, are 29″ and 19″ at 205.2 GHz and 307.7 GHz, respectively.
Spectral data reduction was undertaken using the Grenoble Image and Line Data Analysis Software (GILDAS4; Pety 2005). To enhance the signal-to-noise ratios, we smoothed the observed CF+ spectra to achieve a channel spacing of 1 km s−1 for our subsequent analysis.
3 Results
In Fig. 1, we present the CF+ spectra observed toward N113. Thanks to the high sensitivity of our observations, both spectra exhibit signal-to-noise ratios of >3 channel by channel and >6 for their integrated fluxes, affirming our successful detection of CF+ toward N113. This is the first discovery of this molecular ion in the LMC, and the second extragalactic detection after that in the z = 0.89 foreground galaxy of the gravitational lens-magnified quasar PKS 1830 211 (Muller et al. 2016). CF+ was detected in absorption toward PKS 1830 211, making our observations the first detection of CF+ in emission in an extragalactic object.
The CF+ transitions exhibit splitting by hyperfine structure (see Guzmán et al. 2012b, who list the frequency separations of the hyperfine structure components). However, the corresponding velocity separations (<1 km s−1) are too small to be resolved in our spectra. We find that a single Gaussian component provides adequate fits to our spectra, which delivers the parameters listed in Table 1. The peak intensities are a factor of >10 lower than those observed in the Orion Bar (Neufeld et al. 2006) and the Horsehead PDR (Guzmán et al. 2012a). The measured local standard of rest velocity centroids (≈235 km s−1) agree well with previous measurements of N113’s systemic velocity (e.g., Wang et al. 2009; Seale et al. 2012; Nishimura et al. 2016). Taking the errors into account, we find consistent full width at half maximum (FWHM) line widths for the two CF+ transitions at the 2σ level. The FWHM line widths are also akin to those of other dense gas tracers observed toward N113 (e.g., Wang et al. 2009; Gong et al. 2023), further corroborating our discovery of CF+ in this source. Particularly, previous measurements indicate a line width of 4.78±0.23 km s−1 for the 13CO J = 3 → 2 line measured with an angular resolution of 16″ (Wang et al. 2009), which is comparable to the line widths observed for the CF+ transitions. This similarity suggests that both the 13CO J = 3 → 2 and CF+ lines delineate gas undergoing identical turbulent motions. The observed FWHM line widths of CF+ appear to be broader than those typically observed toward Galactic sources (≲3 km s−1; Neufeld et al. 2006; Guzmán et al. 2012b,a; Nagy et al. 2013, 2017) but narrower than that observed toward PKS 1830–211 (~15 km s−1; Muller et al. 2016). This difference likely arises from the different linear scales probed by these various studies.
In light of the direct link between CF+ and C+ (e.g., Neufeld et al. 2005, 2006; Guzmán et al. 2012a), we reanalyzed the Herschel [CII] 158 µm emission data of N113 that were previously reported by Oliveira et al. (2019). To allow for a meaningful comparison, we convolved the Herschel [CII] data to match the angular resolutions of our CF+ data. The resulting [CII] integrated intensities are 113.9±0.4 K km s−1 and 98.4±0.3 K km s−1 at the angular resolutions of 19″ and 29″, respectively. These values exceed those of the CF+ transitions by over three orders of magnitude in brightness temperature.
Given the limitation of our pointed observations, the spatial distribution of CF+ emission remains unconstrained by our measurements. However, as C+ is the main precursor of CF+, we believe that the distribution of CF+ emission might follow that of C+. The bottom panel of Fig. 2 shows the distribution of the continuum-subtracted [CII] integrated intensity map of N113. Our observed position coincides with the bright [CII] emission in N113 (Oliveira et al. 2019), but is about 3″5 offset with respect to the [CII] peak. The [CII] distribution shows a compact source superimposed on a more extended emission. We performed a Gaussian fitting to the integrated intensity map, yielding a FWHM size of 22″ 6 × 30″9 with a position angle of 72°. This is equivalent to the deconvolved Gaussian FWHM size, θs, of 23″5 (i.e., 6 pc) for the [CII] emission. Since the CF+ transitions are assumed to trace high-density gas (see Sect. 4.1), we adopted θS = 23″5 as an upper limit for our subsequent analysis.
Assuming an excitation temperature of 10 K (e.g., Neufeld et al. 2006; Guzmán et al. 2012a) and a Gaussian FWHM source size of 23″5, we estimate peak optical depths of 0.004 and 0.002 for CF+ (2→1) and (3→2), respectively, based on their peak intensities (<10 mK). Even when considering lower excitation temperatures (i.e., 5 K) and smaller source sizes of 10″–20″, the optical depths remain below 0.1. Furthermore, our statistical equilibrium calculations also confirm that the optical depths are lower than 0.1 (see Sect. 4.1). These findings strongly support that both CF+ transitions can be reliably taken to be optically thin.
To estimate the excitation temperature and column density of CF+, we employed the rotational diagram, which assumes conditions of local thermodynamic equilibrium (LTE; e.g., Goldsmith & Langer 1999), where the intensities were corrected by being divided by the beam dilution factor,  . Because we lack precision source size constraints for the CF+ emitting region in N113, we made calculations assuming three different source sizes (i.e., θS = 23″5, 15″, and 10″). The results are illustrated in Fig. 3. Utilizing linear fits to the rotational diagram, we obtain rotation temperatures of 13.6±4.0 K, 11.9±2.7 K, 11.1±2.1 K, and CF+ column densities of (6.3±1.1)× 1011 cm−2, (l.2±0.2) × 1012 cm−2, and (2.4±0.4) × 1012 cm−2 for source sizes of 23″5, 15″, and 10″, respectively. The rotation temperatures, which, under LTE conditions, are identical to the excitation temperatures, remain relatively consistent in the range of 10–15 K and do not vary significantly with the assumed source size. These values are reasonably in line with previous studies of CF+ in the Milky Way (∽10 K; Neufeld et al. 2006; Guzmán et al. 2012a), but are slightly lower than the excitation temperature of 22±4 K determined by Nagy et al. (2017) for the Orion Bar. The CF+ column densities determined toward N113 are not significantly different from the values of (1–2) × 1012 cm−2 estimated toward the Orion Bar and the Horsehead PDR (Neufeld et al. 2006; Guzmán et al. 2012a; Nagy et al. 2017). This implies that CF+ column densities exhibit a level of consistency within an order of magnitude across various PDRs.
Observed properties of the CF+ transitions.
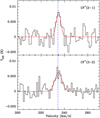 |
Fig. 1 Observed transitions of CF+ toward N113. The corresponding transition is indicated in the top-right corner of each panel. The dashed blue line indicates the systemic velocity of N113. Both spectra have been smoothed to have a channel spacing of ~1 km s−1. |
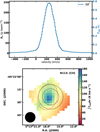 |
Fig. 2 Observed [CII] emission of N113. Top: Herschel/PACS [CII] spectra of the target position. We note that the line profiles are predominantly broadened by the spectral resolution of Herschel/PACS, λ/Δλ ~ 1500 (i.e., ~200 km s−1). A flux uncertainty of 10% is assumed for this measurement (see Table Al in Oliveira et al. 2019). Bottom: Herschel continuum-subtracted [CII] integrated intensity map at its original angular resolution of 12″. The two dashed black circles represent the APEX HPBWs of the CF+ (2→1) and (3→2) observations, while the Gaussian fitting to the [CII] distribution is indicated by the dashed red ellipse. The 158 µm Herschel HPBW is shown in the lower left. |
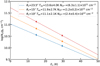 |
Fig. 3 Rotational diagram of CF+ in N113. The dashed lines represent the linear least-square fits to the observed data points for three assumed source sizes. The adopted source size, fitted excitation temperature, and CF+ column density are shown in the upper right. |
4 Discussion
4.1 Density constraints
Previous investigations have demonstrated the utility of multiple CF+ transitions in deriving gas densities within the Milky Way (Desrousseaux et al. 2021). Our successful detection of two CF+ transitions allows us to extend such analyses to an extragalactic environment for the first time. To constrain the gas density of the CF+ emitting zone in N113, we used the RADEX5 code for statistical equilibrium calculations (van der Tak et al. 2007). Our analysis made use of the molecular data for CF+ from the Leiden Atomic and Molecular Database (LAMDA6; Schöier et al. 2005). Specifically, energy levels, rest frequencies, and Einstein A coefficients were extracted from the Cologne Database for Molecular Spectroscopy (CDMS) catalog (Endres et al. 2016). Additionally, we adopted the latest rate coefficients for collisions of CF+ with H2 from Desrousseaux et al. (2021). A total of 22 energy levels and 21 rotational transitions were taken into account in our calculations. Similar to the approach of Desrousseaux et al. (2021), our work exclusively involves collisions of CF+ with para-H2. This is because the computed rate coefficients show no dependence on the nuclear spin (see Desrousseaux et al. 2021 for information). We also note that electron excitation might play a role. However, the CF+-e−1 collisional rates are not available. Adopting the Born approximation formula, as in Neufeld & Dalgarno (1989), we estimate that the CF+-e−1 collisional rate coefficients are on the order of 10−7 cm−3 s−1. These values significantly exceed the corresponding rate coefficients for collisions with para-H2, which are on the order of 10−10 cm−3 s−1. Assuming electron abundances comparable to the average carbon abundance relative to H in the LMC (8 × 10⁻⁵; Dufour et al. 1982), the electron number density is lower than that of para-H2 by about four orders of magnitude. Furthermore, the electron abundances are expected to be even lower in dense regions like N113 (e.g., Caselli et al. 2002). Hence, we suggest that electron collisions with CF+ are negligible in our calculations.
In the modeling process, we constructed regular grids with kinetic temperatures, Tk, ranging from 5 to 150 K with a step of 1 K, and H2 number densities, n(H2), ranging from 103 cm−3 to 107 cm−3 with a logarithmic step of log[n(H2) /cm−3] = 0.1. The column densities and source sizes are based on our observations and the LTE analysis (see Sect. 3), while the line widths are fixed to be 4.7 km s−1 (see Table 1). The physical parameters were optimized by minimizing the χ2 value, which is defined as

where Iobs,i and Imod,i represent the observed and modeled integrated intensities, respectively, and σi denotes the error in Iobs,i. In Eq. (1), Iobs,i has been corrected for the beam dilution effect.
Figure 4 presents the distribution of χ2 as a function of the kinetic temperature and H2 number density from our modeling results. As is clear from this figure, the kinetic temperature is not well constrained by our modeling. However, the H2 number density does not vary much for kinetic temperatures above 30 K. Previous H2CO measurements of N113 suggest kinetic temperatures of ∼50–100 K (Tang et al. 2017, 2021), providing a basis for inferring the H2 number density in the CF+ emitting region of N113. Using the criterion of χ2 < 2.3, corresponding to the 1σ confidence level, and assuming a prior on kinetic temperatures of TK ~ 50–100 K, we infer H2 number densities in the range of 104.3−4.9 cm−3, 104.1−4.8 cm−3, and 103.7−4.8 cm−3 for source sizes of 23″5, 15″, and 10″, respectively. While the derived number densities show a slight decrease with diminishing source size, overall, they do not vary significantly. Hence, we conclude that CF+ should emerge from molecular gas with an H2 number density of (0.5–7.9) × 104 cm−3.
When compared with previous density estimates for the Horsehead PDR and the Orion Bar from CF+ transitions (Desrousseaux et al. 2021), the H2 number density of N113 appears to be comparable to that of the Horsehead PDR (~3.5 × 104 cm−3), but slightly lower than that of the Orion Bar (~1.8 × 105 cm−3). Toward N113, the derived H2 number densities appear to be lower than those (>1 × 105 cm−3) derived from dense gas tracers like CS, HCN, HCO+, H2CO, and HC3× at similar angular resolutions (see Table 5 in Wang et al. 2009), indicating that our CF+ transitions probe lower density molecular gas.
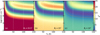 |
Fig. 4 Distribution of x2 as a function of the kinetic temperature and H2 number density. The adopted source size is shown in the lower-right corner of each panel. The dashed orange lines mark the range of x2 < 2.3 that corresponds to the 1σ significance level. The vertical dashed white lines enclose the expected kinetic temperature range. |
4.2 Fluorine abundances
Fluorine abundances have been studied utilizing both neutral fluorine (Federman et al. 2005; Snow et al. 2007) and ionized fluorine (Werner et al. 2005; Zhang & Liu 2005). However, the main method employed for measurements remains centered on the HF molecule, given its significance as the primary fluorine carrier (e.g., Mathew et al. 2023). Consequently, observations of ro-vibrational HF absorption serve as a common approach for investigating fluorine abundances in cool stars within the Milky Way and the LMC (e.g., Jorissen et al. 1992; Cunha et al. 2003; Cunha & Smith 2005). Employing this methodology, the fluorine abundances determined for the Orion K–M dwarfs are comparable to the solar value (Cunha & Smith 2005). In molecular clouds, assessments of fluorine abundances predominantly rely on observations of pure rotational transitions of HF in the vibrational ground state. However, the commonly used (1→0) rotational transition of HF, with a rest frequency of ~ 1232 GHz, has a much higher critical density7 than the CF+ lines studied here and is observed mostly in absorption that can become optically thick (Neufeld et al. 2010). This introduces uncertainties in estimations of fluorine abundances based on HF in many cases. Moreover, as mentioned above, observations of these far-infrared rotational lines are currently not possible due to the absence of facilities operating at these far-infrared wavelengths. In contrast, CF+ transitions can be readily observed by (sub)millimeter telescopes and typically exhibit low optical depths. Therefore, observations of CF+ transitions can offer an alternative method for fluorine abundance determinations.
According to previous studies (Neufeld et al. 2005, 2006; Guzmán et al. 2012a), CF+ is formed through the reactions


and mainly destroyed by dissociative recombination with electrons

This simple chemical network provides a straightforward link between fluorine abundances, [F], CF+ column densities, N(CF+), and total hydrogen column densities, Ntot(H), through the expression (Guzmán et al. 2012a)
![$N\left( {{\rm{C}}{{\rm{F}}^ + }} \right) = {{{k_1}} \over {{k_2}}}\left[ {\rm{F}} \right]{N_{tot}}\left( {\rm{H}} \right),$](/articles/aa/full_html/2024/07/aa49429-24/aa49429-24-eq7.png)
where k1 and k2 are the rate coefficients of reactions (3) and (4), respectively.
Equation (5) highlights the dependence of [F] on the ratio  . The most recent calculations for k1 were performed by Dagdigian et al. (2019), reporting k1 = 4.33 × 10⁻⁹(Tk/300)−0.425exp(−18.29/Tk) cm3 s−1 and 1.50 × 10⁻⁹(Tk/300)−0.442exp(−8.84/Tk) cm3 s−1 for the j = 1/2 and j = 3/2 spin-orbit states, respectively. Assuming that the majority of C+ exists in the lower energy state, we adopted the k1 of the j = 1/2 spin-orbit state for our analysis. Based on measurements from a storage ring experiment, Novotny et al. (2005) found k2 = 5.30 × 10⁻⁸(Tk/300)−0.8 cm3 s−1. Based on previous H2CO measurements, the kinetic temperatures of N113 are expected to fall within the range of 50–100 K (Tang et al. 2017, 2021), which leads to
  ranging from 0.029 to 0.045.
Based on the results in Appendix A, we adopted Ntot(H) = (5.8 ± 0.6) × 1022 cm−2. Since our observations suggest N(CF+) = (0.6–2.5) × 1012 cm−2 (see Sect. 3), we obtain fluorine abundances within the range of [F] = (0.2–1.7) × 10−9 using Eq. (5). Because the adopted total hydrogen column densities are derived at an angular resolution of ~40″, these values are likely lower than total hydrogen column densities determined for higher angular resolution data. Thus, the derived fluorine abundances are considered as upper limits (i.e., [F] ≲ 1.7 × 10⁻⁹). Given that fluorine abundances in molecular clouds within the LMC have not been previously measured, our results represent the first constraint on fluorine abundances in such environments in the LMC.
The measured fluorine abundance in N113 is lower than the value in the Solar System (3 × 10⁻⁸; Anders & Grevesse 1989), but comparable to the abundance (~ 2 × 10⁻⁹) observed in a gravitationally lens-magnified dusty star-forming galaxy at redshift z = 4.4 (Franco et al. 2021). Because fluorine is mainly produced by the helium burning process of asymptotic giant branch (AGB) stars (e.g., Jorissen et al. 1992; Werner et al. 2005), the low fluorine abundance in the lensed galaxy was attributed to insufficient enrichment by AGB stars in the early Universe. However, this explanation does not apply to the LMC, given its considerably older age (e.g., Harris & Zaritsky 2009), which is sufficient for enrichment by AGB stars. On the other hand, the measured fluorine abundance in N113 is about an order of magnitude lower than those ([F]~ 10−8) measured toward red giants in the LMC (Cunha et al. 2003), indicating a substantial deficiency in N113. Based on previous measurements of CF+ toward the Orion Bar (Nagy et al. 2017), we determined a N(CF+)/N(H) ratio of about 3.1 × 10⁻¹¹, corresponding to [F] ≲ 1.1 × 10⁻⁹. Thus, the fluorine abundance in the Orion Bar is also about an order of magnitude lower than those (~3.8 × 10⁻⁸) measured toward stars in the Orion nebula cluster (Cunha & Smith 2005), confirming the trend observed in the LMC.
Previous observations have shown that HF abundances sharply decline in dense environments (Emprechtinger et al. 2012). Similarly, HF abundances were estimated to be as low as a few times 10−10 in massive star formation regions such as Sgr B2 and NGC6334I (Neufeld et al. 1997; Emprechtinger et al. 2012; van der Wiel et al. 2016), attributed to the freeze-out of HF molecules onto dust grains. Following Eqs. (3) and (4) in van der Wiel et al. (2016), we find that the HF adsorption rate surpasses its desorption rate at a kinetic temperature of 100 K and an H number density of ~2 × 104 cm−3, which indicates that the freeze-out of HF molecules can effectively take place in N113. As HF serves as the main precursor of CF+, the freeze-out of HF molecules provides a natural explanation for the observed deficiency of CF+ ions in N113. Therefore, our findings suggest that fluorine abundances measured in dense molecular clouds only represent lower limits for fluorine abundances in galaxies due to the observed CF+ deficiency.
Our simplified network overlooks the potential impact of photodissociation on the destruction of HF and CF+, which could in principle lead to an overestimate of HF and CF+ abundances. However, both HF and CF+ exhibit remarkable stability, characterized by dissociation energies of 5.87 eV and 7.71 eV (Neufeld et al. 2006), respectively. Based on the KInetic Database for Astrochemistry (KIDA8), the photodissociation rate of HF is 1.38 × 10⁻¹⁰exp(−2.99Av) s−1, where Av is the visual extinction. This indicates an exceedingly slow photodissociation rate of ≲10−10. Based on the assumed photodissociation rate of 10−9exp(−2.5Av) s−1 for CF+ (Guzmán et al. 2012a), our calculations indicate that the photodissociation rate of CF+ should be considerably lower than 10−9 s−1. This finding is further supported by Liszt et al. (2015), who proposed a value of 2 × 10⁻¹⁰ s−1. Given these low rates, we posit that the contribution of the photodissociation effects can be neglected. On the other hand, we note that the photodissociation rates are still uncertain. As discussed by Liszt et al. (2015), photodissociation might have the potential to impact CF+ abundances if its rates exceed ≳10−9 s−1. Furthermore, the line-of-sight structures of PDRs can exhibit great complexity in reality, potentially permitting the penetration of UV radiation. Additionally, since CF+ emissions likely trace only a fraction of H2 gas, its abundance derived from the assumed hydrogen column density is underestimated. The photodissociation effects and the overestimated hydrogen column density may lead to lower values when compared with the fluorine abundance derived from our simplified network.
4.3 C+/CF+ ratios
Previous studies indicate that CF+ could act as a proxy for C+ (e.g., Guzmán et al. 2012a). Establishing a known C+/CF+ ratio would enable the inference of C+ column densities from CF+ measurements. While the CF+ column density of N113 has been investigated in Sect. 3, the C+ column density requires constraints derived from the Herschel photodetector array camera and spectrometer (PACS) [CII] spectra (see Fig. 2 for instance).
Given that [CII] is expected to be optically thick in the LMC (Okada et al. 2019b), adopting the optically thin approximation for estimating C+ column densities may not be valid. Instead, we employed RADEX models to quantify the relation between the C+ integrated intensity and its column density. The spectroscopic data for C+ were adopted from the LAMDA database, encompassing 8 energy levels, 14 transitions of C+, and incorporating the most recent collisional rate coefficients (Barinovs et al. 2005; Wilson & Bell 2002; Lique et al. 2013). In our RADEX models, we considered two collisional partners, para-H2 and H. Based on the estimate in Appendix A, we assumed n(H)/n(H2) = 0.1. The line width was held constant at 4.7 km s−1, matching that of the CF+ (2→1) line. Similar to Sect. 4.1, we also constructed regular grids with kinetic temperatures ranging from 5 to 150 K with a step of 1 K, H2 number densities ranging from 103 to 107 cm−3 with a logarithmic step of log[n(H2) cm−3] = 0.1, and C+ column densities ranging from 1016 cm−2 to 1019 cm−2 with a logarithmic step of log[N(C+) /cm−2] = 0.1.
Figure 5 presents the relation between the C+ column density and [CII] integrated intensity, calculated from the RADEX models under different physical conditions. Based on previous H2CO observations of N113 (Tang et al. 2017, 2021), we investigated models with kinetic temperatures of ~50–100 K. Since [CII] emission arises not only from molecular gas but also from ionized gas, the kinetic temperature of the [CII]-emitting region is anticipated to be higher than that of molecular gas traced by H2CO. Furthermore, the low kinetic temperature of 50 K fails to reproduce the observed [CII] integrated intensities in Fig. 5. Hence, we adopted a kinetic temperature of 100 K to estimate the C+ column density. A Gaussian fit to the spectra in Fig. 2 gives [CII] integrated intensities within the range of 99.0144.1 K km s−1 for different beams of 12″–29″. Assuming the absence of beam dilution effects and comparing the observed values with the RADEX models (see Fig. 5), we derive a C+ column density of 1017.9–18.3 cm−2 within the H2 number density range determined in Sect. 4.1. The values are comparable to those found in the N159 star-forming region (see Table 2 of Okada et al. 2015). If we assume that the emission from CF+ is as extended as that from C+ (i.e., θs = 23″5), the CF+/C+ column density ratio is about (3.0–7.6) × 10−7, which is comparable to the estimated value (~5 × 10⁻⁷) in the Orion Bar (Neufeld et al. 2006).
Based on Reactions (3) and (4), Neufeld et al. (2006) suggested a theoretical C+/CF+ ratio in equilibrium,

where ne denotes the electron density. Assuming ne ~ n(C+) ~ nc and n(HF) ~ nF, we can substitute Eq. (6) with

where  represents the fluorine abundance, and
  is the carbon abundance. Adopting
  (Cunha et al. 2003) and
  (Dufour et al. 1982) based on previous abundance measurements in the LMC, the theoretical
  ratio is anticipated to be (3.6–5.6) × 10−6 within the temperature range of 50–100 K in the LMC, which is higher than our derived value of (3.0–7.6) × 10−7 in N113. As illustrated in Fig. 5, a decrease in kinetic temperature results in an elevated C+ column density, thereby yielding even lower CF+/C+ column density ratios. Therefore, our conclusion that the derived CF+/C+ ratio is lower than the theoretical prediction remains robust even if we assume kinetic temperatures lower than 100 K.
Equation (7) implies that the  ratio is directly proportional to the chosen fluorine abundance. If we consider a fluorine abundance of ≲2.2 × 10⁻⁹ in molecular clouds (see Sect. 4.2) instead of the fluorine abundance measured toward red giants (Cunha et al. 2003), the estimated equilibrium ratio decreases to ≲1 × 10⁻⁶, which is comparable to the observed ratio. Therefore, we suggest that the low CF+/C+ column density ratios are expected in dense PDRs where CF+ deficiency is observed.
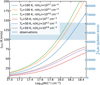 |
Fig. 5 Relation between the C+ column density and [CII] integrated intensity predicted by the RADEX models. |
5 Summary and conclusion
In this work we conducted targeted observations with the APEX 12 m submillimeter telescope toward N113, a region of active star formation located in the LMC. Our observations have led to the successful detection of the J = 2 → 1 and 3 → 2 lines of CF+, the first discovery of this molecule in the LMC and in fact the second extragalactic detection ever. Our LTE analysis indicates an excitation temperature of 11.1–13.6 K and a CF+ column density of (0.6–2.4) × 1012 cm−2 for an assumed source size of 10″–23″5. Based on non-LTE models, we infer that CF+ emission emerges from dense PDRs with an H2 number density of (0.5–7.9) × 104 cm−3 in N113. Based on a simple chemical network for CF+, we further infer a fluorine abundance of ≲1.7 × 10⁻⁹, which is about an order of magnitude lower than measurements toward red giants in the LMC. Such a CF+ deficiency also gives rise to a lower CF+/C+ column density ratio in dense PDRs. Therefore, we propose that CF+ measurements can exclusively serve as conservative estimates, establishing lower bounds for both fluorine abundances and C+ column densities in galaxies. Our study highlights the utility of CF+ transitions, even when offering only lower limits, as an alternative tracer for probing the abundances of ionized carbon and fluorine. This opens a new avenue to assess chemical evolution in low-metallicity galaxies in the early Universe.
Acknowledgements
We express our gratitude to the APEX staff for their invaluable assistance throughout our observations. We thank Prof. David A. Neufeld for his insightful comments on this draft. C.-H.R. C. acknowledges support from the Deutsches Zentrum für Luft- und Raumfahrt (DLR) grant NS1 under contract no. 50 OR 2214. The data were collected under the Atacama Pathfinder EXperiment (APEX) project, led by the Max Planck Institute for Radio Astronomy under the umbrella of the ESO La Silla Paranal Observatory. This research has made use of NASA’s Astrophysics Data System. This work also made use of Python libraries including Astropy (https://www.astropy.org/; Astropy Collaboration 2013), NumPy (https://www.numpy.org/; van der Walt et al.2011), SciPy (https://www.scipy.org/; Jones et al. 2001), and Matplotlib (https://matplotlib.org/; Hunter 2007). We would like to thank the referee for the valuable comments that have contributed to the improvement of this paper.
Appendix A Hydrogen column density
To determine the hydrogen column density toward our N113 position, we employed a modified-blackbody emission model (e.g., Kauffmann et al. 2008; Lin et al. 2017):

where Ω represents the solid angle, Bv(Td) is the Planck function at a dust temperature of Td, and τv is the optical depth of the dust emission at the observed frequency, v; the total hydrogen column density, Ntot(H), is expressed as

where the gas-to-dust ratio, rGDR, is assumed to be 300 in the LMC (Roman-Duval et al. 2014; Sewiło et al. 2022), κv is the dust opacity at the given frequency, and mH represents the mass of a hydrogen atom. The dust opacity is modeled as  (Hildebrand 1983), where κ230 is 0.8 cm2 g−1 at 230 GHz according to Ossenkopf & Henning (1994), and β is the dust spectral index.
In this study, we utilized Herschel continuum data9 (Gordon et al. 2014), with foreground emission from Milky Way dust subtracted. This dataset has a HPBW of 40″, corresponding to a solid angle of 4.26×10⁻⁸ sr. We used two approaches for the spectral energy distribution fitting of N113. We first fixed the dust spectral index to be 1.96 for the fitting, and the result is indicated by the orange curve in Fig. A.1. The resulting parameters are Td = 19.8 ± 2.2 K and Ntot(H) = (7.2 ± 1.6) × 1022 cm−2. However, this fit does not match the 100 µm and 160 µm data points well, which could be the so-called submillimeter flattening probably caused by different dust components (e.g., Paradis et al. 2019). Hence, the fitting procedure was repeated with the dust spectral index considered as a free parameter, yielding the blue curve in Fig. A.1. This approach resulted in Td = 36.0 ± 5.4 K, Ntot(H) = (5.8 ± 0.6) × 1022 cm−2, and β = 1.18 ± 0.15. Despite variations in Td and β the hydrogen column densities obtained through the two approaches are found to be comparable. Considering that the latter approach matches the data better, we chose Ntot(H) = N(H) + 2N(H2) = (5.8 ± 0.6) × 1022 cm−2 for our analysis, where N(H) is the hydrogen column density in the atomic phase and N(H2) is the H2 column density (i.e., the hydrogen column density in the molecular phase). Because the hydrogen column density in the atomic phase is N(H) ~ 2.6 × 1021 cm−2 from N113 (Kim et al. 2003), the hydrogen column density in the molecular phase is thus N(H2) ~ 2.8 × 1022 cm−2 and the corresponding N(H)/N(H2) ratio is ~10%. This ratio manifests the dominance of the molecular phase in N113.
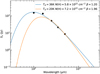 |
Fig. A.1 Spectral energy distribution of N113 fitted with a single modified blackbody model. The fitted values are indicated in the uppe-right corner. |
References
- Anders, E., & Grevesse, N. 1989, Geochim. Cosmochim. Acta, 53, 197 [Google Scholar]
- Astropy Collaboration (Robitaille, T. P., et al.) 2013, A&A, 558, A33 [NASA ADS] [CrossRef] [EDP Sciences] [Google Scholar]
- Barinovs, Ǧ., van Hemert, M. C., Krems, R., & Dalgarno, A. 2005, ApJ, 620, 537 [NASA ADS] [CrossRef] [Google Scholar]
- Belitsky, V., Bylund, M., Desmaris, V., et al. 2018a, A&A, 611, A98 [NASA ADS] [CrossRef] [EDP Sciences] [Google Scholar]
- Belitsky, V., Lapkin, I., Fredrixon, M., et al. 2018b, A&A, 612, A23 [NASA ADS] [CrossRef] [EDP Sciences] [Google Scholar]
- Brinkmann, N., Wyrowski, F., Kauffmann, J., et al. 2020, A&A, 636, A39 [NASA ADS] [CrossRef] [EDP Sciences] [Google Scholar]
- Brooks, K. J., & Whiteoak, J. B. 1997, MNRAS, 291, 395 [CrossRef] [Google Scholar]
- Carlson, L. R., Sewiło, M., Meixner, M., Romita, K. A., & Lawton, B. 2012, A&A, 542, A66 [NASA ADS] [CrossRef] [EDP Sciences] [Google Scholar]
- Caselli, P., Walmsley, C. M., Zucconi, A., et al. 2002, ApJ, 565, 344 [Google Scholar]
- Cazzoli, G., Cludi, L., Puzzarini, C., & Gauss, J. 2010, A&A, 509, A1 [Google Scholar]
- Chin, Y. N., Henkel, C., Whiteoak, J. B., et al. 1997, A&A, 317, 548 [Google Scholar]
- Cunha, K., & Smith, V. V. 2005, ApJ, 626, 425 [NASA ADS] [CrossRef] [Google Scholar]
- Cunha, K., Smith, V. V., Lambert, D. L., & Hinkle, K. H. 2003, AJ, 126, 1305 [NASA ADS] [CrossRef] [Google Scholar]
- Dagdigian, P. J., Kłos, J., Wolfire, M., & Neufeld, D. A. 2019, ApJ, 872, 203 [NASA ADS] [CrossRef] [Google Scholar]
- Desrousseaux, B., Lique, F., Goicoechea, J. R., Quintas-Sánchez, E., & Dawes, R. 2021, A&A, 645, A8 [NASA ADS] [CrossRef] [EDP Sciences] [Google Scholar]
- Draine, B. T. 2011, Physics of the Interstellar and Intergalactic Medium (Princeton: Princeton University Press) [Google Scholar]
- Dufour, R. J., Shields, G. A., & Talbot, R. J. J., 1982, ApJ, 252, 461 [NASA ADS] [CrossRef] [Google Scholar]
- Ellingsen, S. P., Breen, S. L., Caswell, J. L., Quinn, L. J., & Fuller, G. A. 2010, MNRAS, 404, 779 [NASA ADS] [CrossRef] [Google Scholar]
- Emprechtinger, M., Monje, R. R., van der Tak, F. F. S., et al. 2012, ApJ, 756, 136 [CrossRef] [Google Scholar]
- Endres, C. P., Schlemmer, S., Schilke, P., Stutzki, J., & Müller, H. S. P. 2016, J. Mol. Spectrosc., 327, 95 [NASA ADS] [CrossRef] [Google Scholar]
- Fechtenbaum, S., Bontemps, S., Schneider, N., et al. 2015, A&A, 574, L4 [NASA ADS] [CrossRef] [EDP Sciences] [Google Scholar]
- Federman, S. R., Sheffer, Y., Lambert, D. L., & Smith, V. V. 2005, ApJ, 619, 884 [NASA ADS] [CrossRef] [Google Scholar]
- Franco, M., Coppin, K. E. K., Geach, J. E., et al. 2021, Nat. Astron., 5, 1240 [Google Scholar]
- Gerin, M., Neufeld, D. A., & Goicoechea, J. R. 2016, ARA&A, 54, 181 [NASA ADS] [CrossRef] [Google Scholar]
- Gerin, M., Liszt, H., Neufeld, D., et al. 2019, A&A, 622, A26 [NASA ADS] [CrossRef] [EDP Sciences] [Google Scholar]
- Goldsmith, P. F., & Langer, W. D. 1999, ApJ, 517, 209 [Google Scholar]
- Gong, Y., Henkel, C., Menten, K. M., et al. 2023, A&A, 679, L6 [NASA ADS] [CrossRef] [EDP Sciences] [Google Scholar]
- Gordon, K. D., Roman-Duval, J., Bot, C., et al. 2014, ApJ, 797, 85 [NASA ADS] [CrossRef] [Google Scholar]
- Gruendl, R. A., & Chu, Y.-H. 2009, ApJS, 184, 172 [Google Scholar]
- Güsten, R., Nyman, L. Å., Schilke, P., et al. 2006, A&A, 454, L13 [NASA ADS] [CrossRef] [EDP Sciences] [Google Scholar]
- Guzmán, V., Pety, J., Gratier, P., et al. 2012a, A&A, 543, L1 [CrossRef] [EDP Sciences] [Google Scholar]
- Guzmán, V., Roueff, E., Gauss, J., et al. 2012b, A&A, 548, A94 [NASA ADS] [CrossRef] [EDP Sciences] [Google Scholar]
- Harris, J., & Zaritsky, D. 2009, AJ, 138, 1243 [NASA ADS] [CrossRef] [Google Scholar]
- Heikkila, A., Johansson, L. E. B., & Olofsson, H. 1998, A&A, 332, 493 [NASA ADS] [Google Scholar]
- Herrera-Camus, R., Bolatto, A. D., Wolfire, M. G., et al. 2015, ApJ, 800, 1 [Google Scholar]
- Hildebrand, R. H. 1983, QJRAS, 24, 267 [NASA ADS] [Google Scholar]
- Hollenbach, D. J., & Tielens, A. G. G. M. 1999, Rev. Mod. Phys., 71, 173 [Google Scholar]
- Hunter, J. D. 2007, Comput. Sci. Eng., 9, 90 [NASA ADS] [CrossRef] [Google Scholar]
- Imai, H., Katayama, Y., Ellingsen, S. P., & Hagiwara, Y. 2013, MNRAS, 432, L16 [NASA ADS] [CrossRef] [Google Scholar]
- Israel, F. P., Maloney, P. R., Geis, N., et al. 1996, ApJ, 465, 738 [Google Scholar]
- Jones, E., Oliphant, T., Peterson, P., et al. 2001, SciPy: Open source scientific tools for Python, http://www.scipy.org/ [Google Scholar]
- Jorissen, A., Smith, V. V., & Lambert, D. L. 1992, A&A, 261, 164 [NASA ADS] [Google Scholar]
- Kalenskii, S. V., & Johansson, L. E. B. 2010a, Astron. Rep., 54, 295 [Google Scholar]
- Kalenskii, S. V., & Johansson, L. E. B. 2010b, Astron. Rep., 54, 1084 [Google Scholar]
- Kauffmann, J., Bertoldi, F., Bourke, T. L., Evans, N. J. I., & Lee, C. W. 2008, A&A, 487, 993 [NASA ADS] [CrossRef] [EDP Sciences] [Google Scholar]
- Kavak, Ü., van der Tak, F. F. S., Tielens, A. G. G. M., & Shipman, R. F. 2019, A&A, 631, A117 [NASA ADS] [CrossRef] [EDP Sciences] [Google Scholar]
- Kim, S., Staveley-Smith, L., Dopita, M. A., et al. 2003, ApJS, 148, 473 [Google Scholar]
- Klein, B., Hochgürtel, S., Krämer, I., et al. 2012, A&A, 542, L3 [NASA ADS] [CrossRef] [EDP Sciences] [Google Scholar]
- Langer, W. D., Velusamy, T., Pineda, J. L., Willacy, K., & Goldsmith, P. F. 2014, A&A, 561, A122 [NASA ADS] [CrossRef] [EDP Sciences] [Google Scholar]
- Lebouteiller, V., Cormier, D., Madden, S. C., et al. 2019, A&A, 632, A106 [EDP Sciences] [Google Scholar]
- Lin, Y., Liu, H. B., Dale, J. E., et al. 2017, ApJ, 840, 22 [CrossRef] [Google Scholar]
- Lique, F., Werfelli, G., Halvick, P., et al. 2013, J. Chem. Phys., 138, 204314 [NASA ADS] [CrossRef] [Google Scholar]
- Liszt, H. S., Pety, J., Gerin, M., & Lucas, R. 2014, A&A, 564, A64 [NASA ADS] [CrossRef] [EDP Sciences] [Google Scholar]
- Liszt, H. S., Guzmán, V. V., Pety, J., et al. 2015, A&A, 579, A12 [NASA ADS] [CrossRef] [EDP Sciences] [Google Scholar]
- Mathew, T., Munoz, S. B., Forni, O., Tressaud, A., & Prakash, G. K. S. 2023, J. Fluorine Chem., 269, 110149 [NASA ADS] [CrossRef] [Google Scholar]
- Meledin, D., Lapkin, I., Fredrixon, M., et al. 2022, A&A, 668, A2 [NASA ADS] [CrossRef] [EDP Sciences] [Google Scholar]
- Muders, D., Hafok, H., Wyrowski, F., et al. 2006, A&A, 454, L25 [NASA ADS] [CrossRef] [EDP Sciences] [Google Scholar]
- Muller, S., Kawaguchi, K., Black, J. H., & Amano, T. 2016, A&A, 589, L5 [NASA ADS] [CrossRef] [EDP Sciences] [Google Scholar]
- Nagy, Z., Van der Tak, F. F. S., Ossenkopf, V., et al. 2013, A&A, 550, A96 [NASA ADS] [CrossRef] [EDP Sciences] [Google Scholar]
- Nagy, Z., Choi, Y., Ossenkopf-Okada, V., et al. 2017, A&A, 599, A22 [NASA ADS] [CrossRef] [EDP Sciences] [Google Scholar]
- Neufeld, D. A., & Dalgarno, A. 1989, Phys. Rev. A, 40, 633 [NASA ADS] [CrossRef] [Google Scholar]
- Neufeld, D. A., & Wolfire, M. G. 2009, ApJ, 706, 1594 [Google Scholar]
- Neufeld, D. A., Zmuidzinas, J., Schilke, P., & Phillips, T. G. 1997, ApJ, 488, L141 [NASA ADS] [CrossRef] [Google Scholar]
- Neufeld, D. A., Wolfire, M. G., & Schilke, P. 2005, ApJ, 628, 260 [Google Scholar]
- Neufeld, D. A., Schilke, P., Menten, K. M., et al. 2006, A&A, 454, L37 [NASA ADS] [CrossRef] [EDP Sciences] [Google Scholar]
- Neufeld, D. A., Sonnentrucker, P., Phillips, T. G., et al. 2010, A&A, 518, L108 [NASA ADS] [CrossRef] [EDP Sciences] [Google Scholar]
- Nishimura, Y., Shimonishi, T., Watanabe, Y., et al. 2016, ApJ, 818, 161 [NASA ADS] [CrossRef] [Google Scholar]
- Novotny, O., Mitchell, J. B. A., LeGarrec, J. L., et al. 2005, J. Phys. B Atm. Mol. Opt. Phys., 38, 1471 [NASA ADS] [CrossRef] [Google Scholar]
- Okada, Y., Requena-Torres, M. A., Güsten, R., et al. 2015, A&A, 580, A54 [NASA ADS] [CrossRef] [EDP Sciences] [Google Scholar]
- Okada, Y., Güsten, R., Requena-Torres, M. A., et al. 2019a, A&A, 621, A62 [NASA ADS] [CrossRef] [EDP Sciences] [Google Scholar]
- Okada, Y., Higgins, R., Ossenkopf-Okada, V., et al. 2019b, A&A, 631, L12 [NASA ADS] [CrossRef] [EDP Sciences] [Google Scholar]
- Oliveira, J. M., van Loon, J. T., Sewiło, M., et al. 2019, MNRAS, 490, 3909 [NASA ADS] [CrossRef] [Google Scholar]
- Ossenkopf, V., & Henning, T. 1994, A&A, 291, 943 [NASA ADS] [Google Scholar]
- Paradis, D., Mény, C., Juvela, M., Noriega-Crespo, A., & Ristorcelli, I. 2019, A&A, 627, A15 [NASA ADS] [CrossRef] [EDP Sciences] [Google Scholar]
- Paron, S., Ortega, M. E., Cunningham, M., et al. 2014, A&A, 572, A56 [NASA ADS] [CrossRef] [EDP Sciences] [Google Scholar]
- Pety, J. 2005, in SF2A-2005: Semaine de l’Astrophysique Francaise, eds. F. Casoli, T. Contini, J. M. Hameury, & L. Pagani (Paris: EDP Sciences), 721 [Google Scholar]
- Pietrzyýnski, G., Graczyk, D., Gallenne, A., et al. 2019, Nature, 567, 200 [NASA ADS] [CrossRef] [Google Scholar]
- Pineda, J. L., Langer, W. D., Velusamy, T., & Goldsmith, P. F. 2013, A&A, 554, A103 [CrossRef] [EDP Sciences] [Google Scholar]
- Poglitsch, A., Krabbe, A., Madden, S. C., et al. 1995, ApJ, 454, 293 [NASA ADS] [CrossRef] [Google Scholar]
- Roman-Duval, J., Gordon, K. D., Meixner, M., et al. 2014, ApJ, 797, 86 [NASA ADS] [CrossRef] [Google Scholar]
- Schöier, F. L., van der Tak, F. F. S., van Dishoeck, E. F., & Black, J. H. 2005, A&A, 432, 369 [Google Scholar]
- Seale, J. P., Looney, L. W., Wong, T., et al. 2012, ApJ, 751, 42 [NASA ADS] [CrossRef] [Google Scholar]
- Sewiło, M., Indebetouw, R., Carlson, L. R., et al. 2010, A&A, 518, L73 [NASA ADS] [CrossRef] [EDP Sciences] [Google Scholar]
- Sewiło, M., Indebetouw, R., Charnley, S. B., et al. 2018, ApJ, 853, L19 [CrossRef] [Google Scholar]
- Sewiło, M., Cordiner, M., Charnley, S. B., et al. 2022, ApJ, 931, 102 [CrossRef] [Google Scholar]
- Snow, T. P., Destree, J. D., & Jensen, A. G. 2007, ApJ, 655, 285 [NASA ADS] [CrossRef] [Google Scholar]
- Tang, X. D., Henkel, C., Chen, C. H. R., et al. 2017, A&A, 600, A16 [NASA ADS] [CrossRef] [EDP Sciences] [Google Scholar]
- Tang, X. D., Henkel, C., Menten, K. M., et al. 2021, A&A, 655, A12 [NASA ADS] [CrossRef] [EDP Sciences] [Google Scholar]
- van der Tak, F. F. S., Black, J. H., Schöier, F. L., Jansen, D. J., & van Dishoeck, E. F. 2007, A&A, 468, 627 [NASA ADS] [CrossRef] [EDP Sciences] [Google Scholar]
- van der Tak, F. F. S., Ossenkopf, V., Nagy, Z., et al. 2012, A&A, 537, L10 [NASA ADS] [CrossRef] [EDP Sciences] [Google Scholar]
- van der Walt, S., Colbert, S. C., & Varoquaux, G. 2011, Comput. Sci. Eng., 13, 22 [Google Scholar]
- van der Wiel, M. H. D., Naylor, D. A., Makiwa, G., Satta, M., & Abergel, A. 2016, A&A, 593, A37 [NASA ADS] [CrossRef] [EDP Sciences] [Google Scholar]
- Wang, M., Chin, Y. N., Henkel, C., Whiteoak, J. B., & Cunningham, M. 2009, ApJ, 690, 580 [CrossRef] [Google Scholar]
- Werner, K., Rauch, T., & Kruk, J. W. 2005, A&A, 433, 641 [NASA ADS] [CrossRef] [EDP Sciences] [Google Scholar]
- Wilson, N. J., & Bell, K. L. 2002, MNRAS, 337, 1027 [NASA ADS] [CrossRef] [Google Scholar]
- Wolfire, M. G., McKee, C. F., Hollenbach, D., & Tielens, A. G. G. M. 2003, ApJ, 587, 278 [Google Scholar]
- Wolfire, M. G., Hollenbach, D., & McKee, C. F. 2010, ApJ, 716, 1191 [Google Scholar]
- Wolfire, M. G., Vallini, L., & Chevance, M. 2022, ARA&A, 60, 247 [NASA ADS] [CrossRef] [Google Scholar]
- Zhang, Y., & Liu, X. W. 2005, ApJ, 631, L61 [NASA ADS] [CrossRef] [Google Scholar]
The multi-module Swedish-ESO PI Instrument for APEX (SEPIA) was designed and built by the Group for Advanced Receiver Development (GARD), at Onsala Space Observatory (OSO) in collaboration with ESO; see https://www.apex-telescope.org/ns/instruments/sepia/sepial80/
HF (1→0) has a critical density of ∼5 × 109 cm−3 (van der Tak et al. 2012), while low J CF+ lines have critical densities of < 2 × 106 cm−3 (see Table 1 in Desrousseaux et al. 2021).
All Tables
All Figures
|
Fig. 1 Observed transitions of CF+ toward N113. The corresponding transition is indicated in the top-right corner of each panel. The dashed blue line indicates the systemic velocity of N113. Both spectra have been smoothed to have a channel spacing of ~1 km s−1. |
| In the text | |
|
Fig. 2 Observed [CII] emission of N113. Top: Herschel/PACS [CII] spectra of the target position. We note that the line profiles are predominantly broadened by the spectral resolution of Herschel/PACS, λ/Δλ ~ 1500 (i.e., ~200 km s−1). A flux uncertainty of 10% is assumed for this measurement (see Table Al in Oliveira et al. 2019). Bottom: Herschel continuum-subtracted [CII] integrated intensity map at its original angular resolution of 12″. The two dashed black circles represent the APEX HPBWs of the CF+ (2→1) and (3→2) observations, while the Gaussian fitting to the [CII] distribution is indicated by the dashed red ellipse. The 158 µm Herschel HPBW is shown in the lower left. |
| In the text | |
|
Fig. 3 Rotational diagram of CF+ in N113. The dashed lines represent the linear least-square fits to the observed data points for three assumed source sizes. The adopted source size, fitted excitation temperature, and CF+ column density are shown in the upper right. |
| In the text | |
|
Fig. 4 Distribution of x2 as a function of the kinetic temperature and H2 number density. The adopted source size is shown in the lower-right corner of each panel. The dashed orange lines mark the range of x2 < 2.3 that corresponds to the 1σ significance level. The vertical dashed white lines enclose the expected kinetic temperature range. |
| In the text | |
|
Fig. 5 Relation between the C+ column density and [CII] integrated intensity predicted by the RADEX models. |
| In the text | |
|
Fig. A.1 Spectral energy distribution of N113 fitted with a single modified blackbody model. The fitted values are indicated in the uppe-right corner. |
| In the text | |
Current usage metrics show cumulative count of Article Views (full-text article views including HTML views, PDF and ePub downloads, according to the available data) and Abstracts Views on Vision4Press platform.
Data correspond to usage on the plateform after 2015. The current usage metrics is available 48-96 hours after online publication and is updated daily on week days.
Initial download of the metrics may take a while.