Fig. 2
Download original image
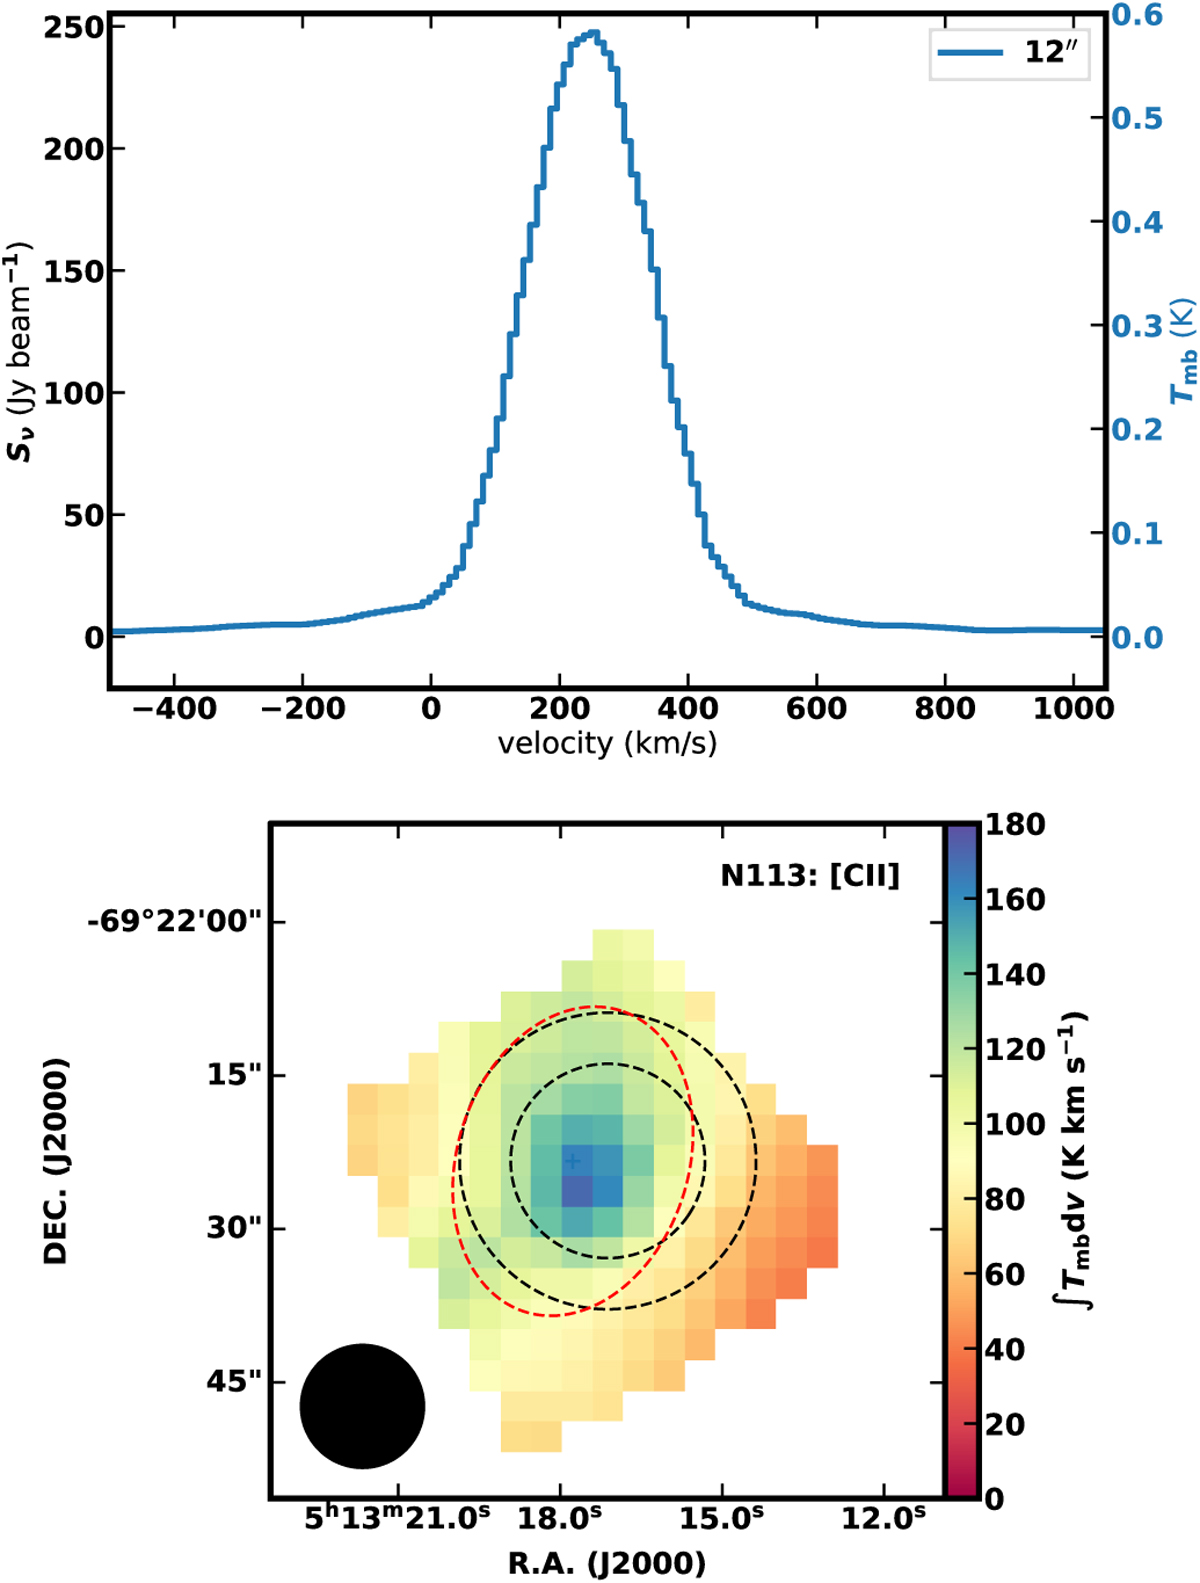
Observed [CII] emission of N113. Top: Herschel/PACS [CII] spectra of the target position. We note that the line profiles are predominantly broadened by the spectral resolution of Herschel/PACS, λ/Δλ ~ 1500 (i.e., ~200 km s−1). A flux uncertainty of 10% is assumed for this measurement (see Table Al in Oliveira et al. 2019). Bottom: Herschel continuum-subtracted [CII] integrated intensity map at its original angular resolution of 12″. The two dashed black circles represent the APEX HPBWs of the CF+ (2→1) and (3→2) observations, while the Gaussian fitting to the [CII] distribution is indicated by the dashed red ellipse. The 158 µm Herschel HPBW is shown in the lower left.
Current usage metrics show cumulative count of Article Views (full-text article views including HTML views, PDF and ePub downloads, according to the available data) and Abstracts Views on Vision4Press platform.
Data correspond to usage on the plateform after 2015. The current usage metrics is available 48-96 hours after online publication and is updated daily on week days.
Initial download of the metrics may take a while.