Fig. 4.
Download original image
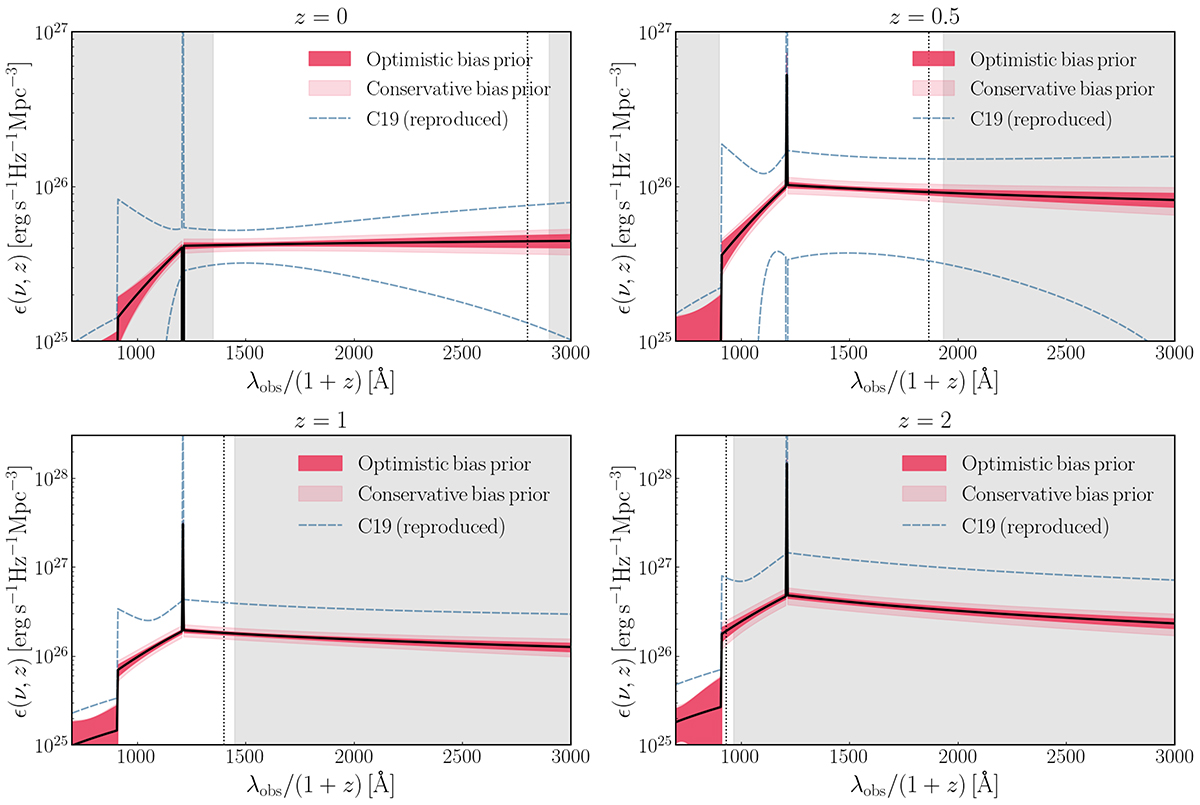
Forecasts at 1σ on the UV-EBL emissivity ϵ(ν, z) at different redshifts for (GALEX+ULTRASAT)×DESI compared with our “post-diction” at 1σ for GALEX×SDSS as in Chiang et al. (2019) (compare with Fig. 6 in their work). We tested both the optimistic and conservative bias priors described in Table 4. The gray shaded area delimits the observational window of GALEX+ULTRASAT, and the gray vertical line shows where GALEX NUV would stop if ULTRASAT was not included. The parts of the spectrum inside the observed window were directly probed via the CBR, while the others are model-based extrapolations.
Current usage metrics show cumulative count of Article Views (full-text article views including HTML views, PDF and ePub downloads, according to the available data) and Abstracts Views on Vision4Press platform.
Data correspond to usage on the plateform after 2015. The current usage metrics is available 48-96 hours after online publication and is updated daily on week days.
Initial download of the metrics may take a while.