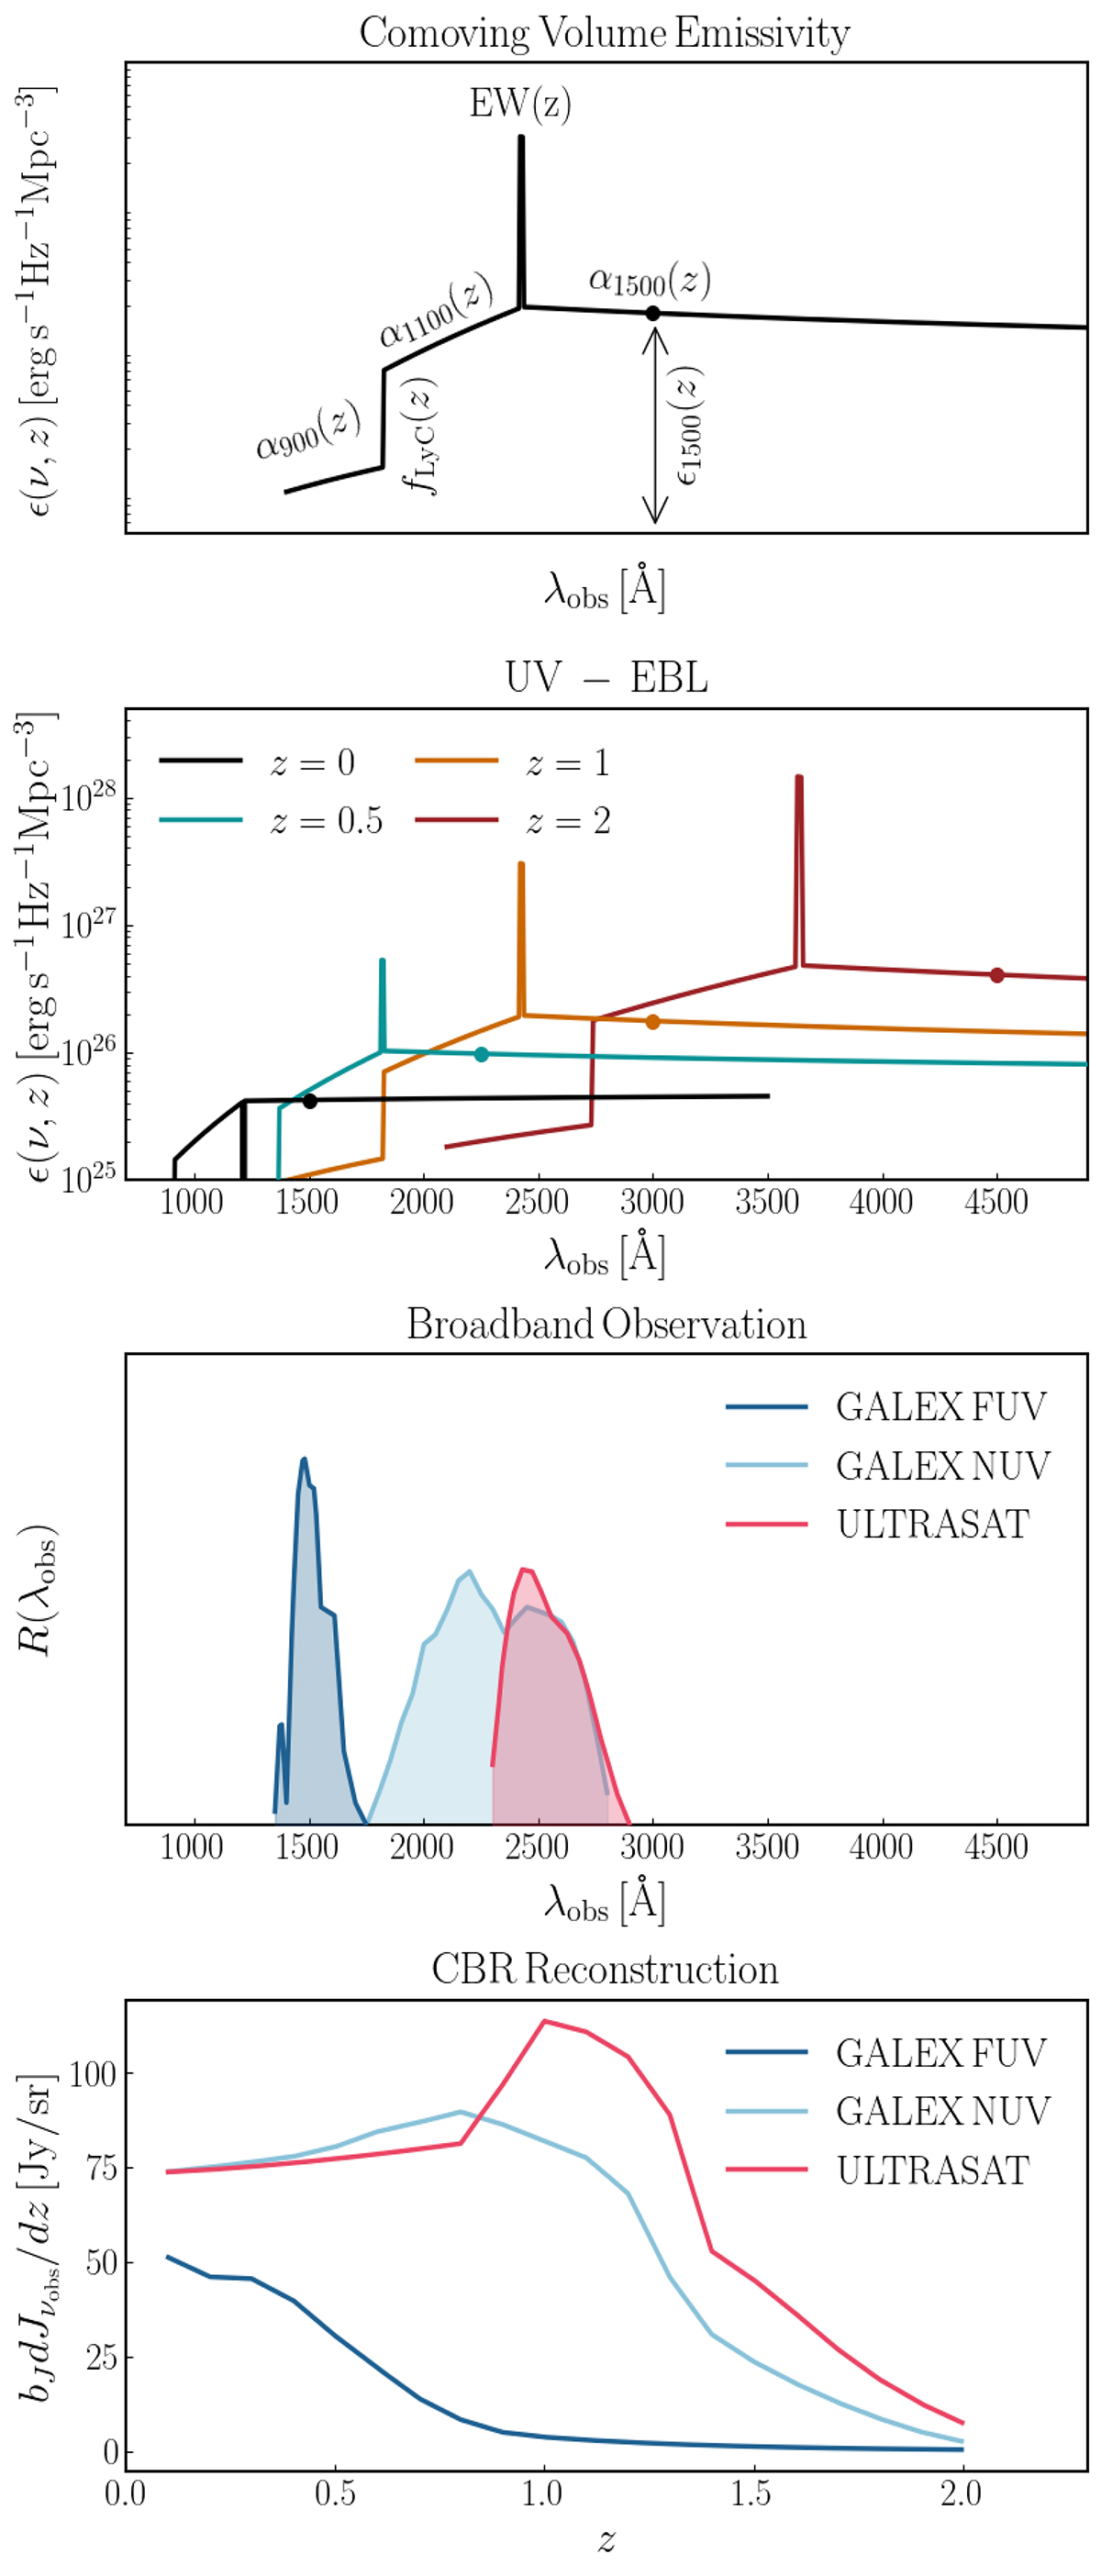
Fig. 1.
Download original image
Summary of the modeling in our analysis. We characterized the UV volume emissivity ϵ(ν, z) based on Eqs. (3)–(6) (panel 1). Emissions from different z contribute to the EBL (panel 2, the dots show λrest = 1500 Å; the Lyα line is in absorption at low z), which is weighted by the detector response function in the broadband observation in Eq. (10) (panel 3). The CBR allowed us to reconstruct bJ(z)dJνobs/dz in Eqs. (11) and (13) (panel 4). This figure is inspired by Chiang et al. (2019).
Current usage metrics show cumulative count of Article Views (full-text article views including HTML views, PDF and ePub downloads, according to the available data) and Abstracts Views on Vision4Press platform.
Data correspond to usage on the plateform after 2015. The current usage metrics is available 48-96 hours after online publication and is updated daily on week days.
Initial download of the metrics may take a while.