Open Access
Fig. 9
Download original image
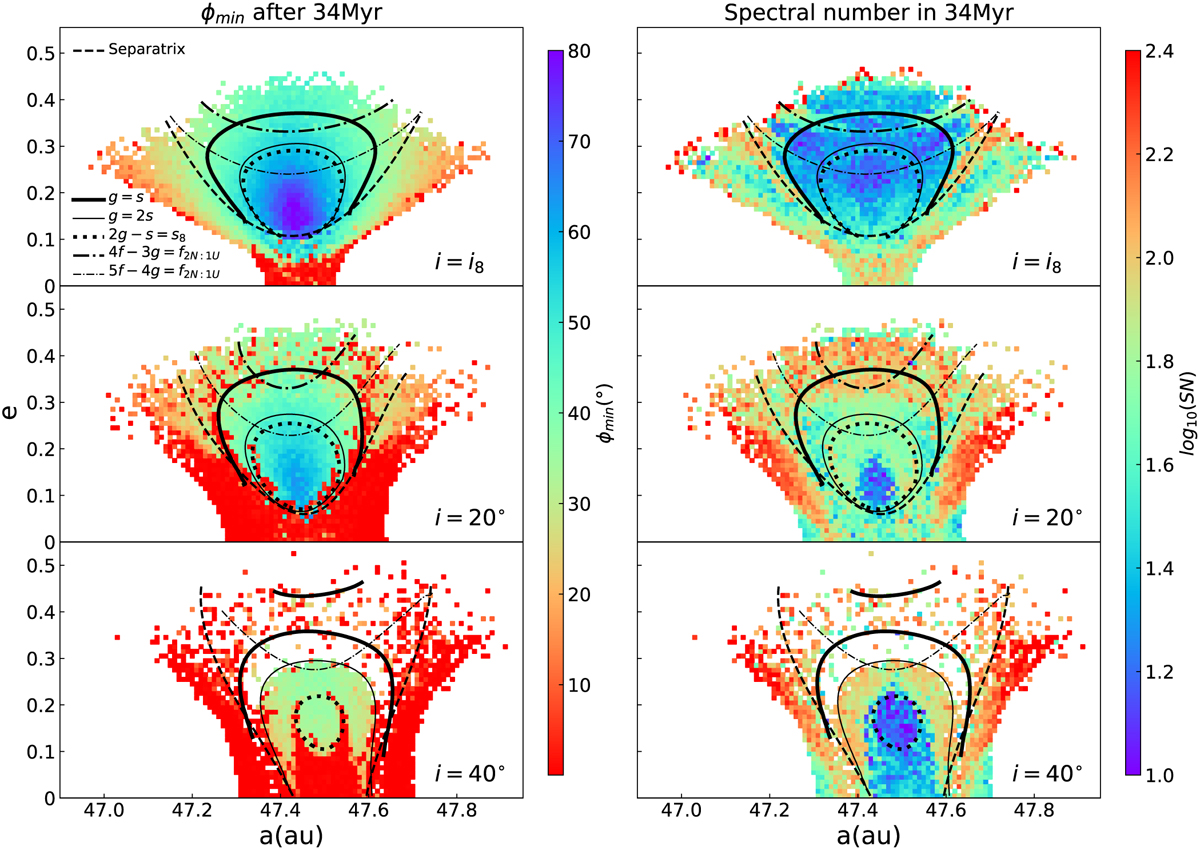
Stability map of the 1:2 resonance in the (a, e) plane. The ϕmin and the SN are indicated by colour in the left and the right column, respectively. The locations of the secular mechanisms (see text) and the boundary between horseshoe resonance and asymmetric resonance islands are plotted as lines of different types.
Current usage metrics show cumulative count of Article Views (full-text article views including HTML views, PDF and ePub downloads, according to the available data) and Abstracts Views on Vision4Press platform.
Data correspond to usage on the plateform after 2015. The current usage metrics is available 48-96 hours after online publication and is updated daily on week days.
Initial download of the metrics may take a while.