Fig. 8
Download original image
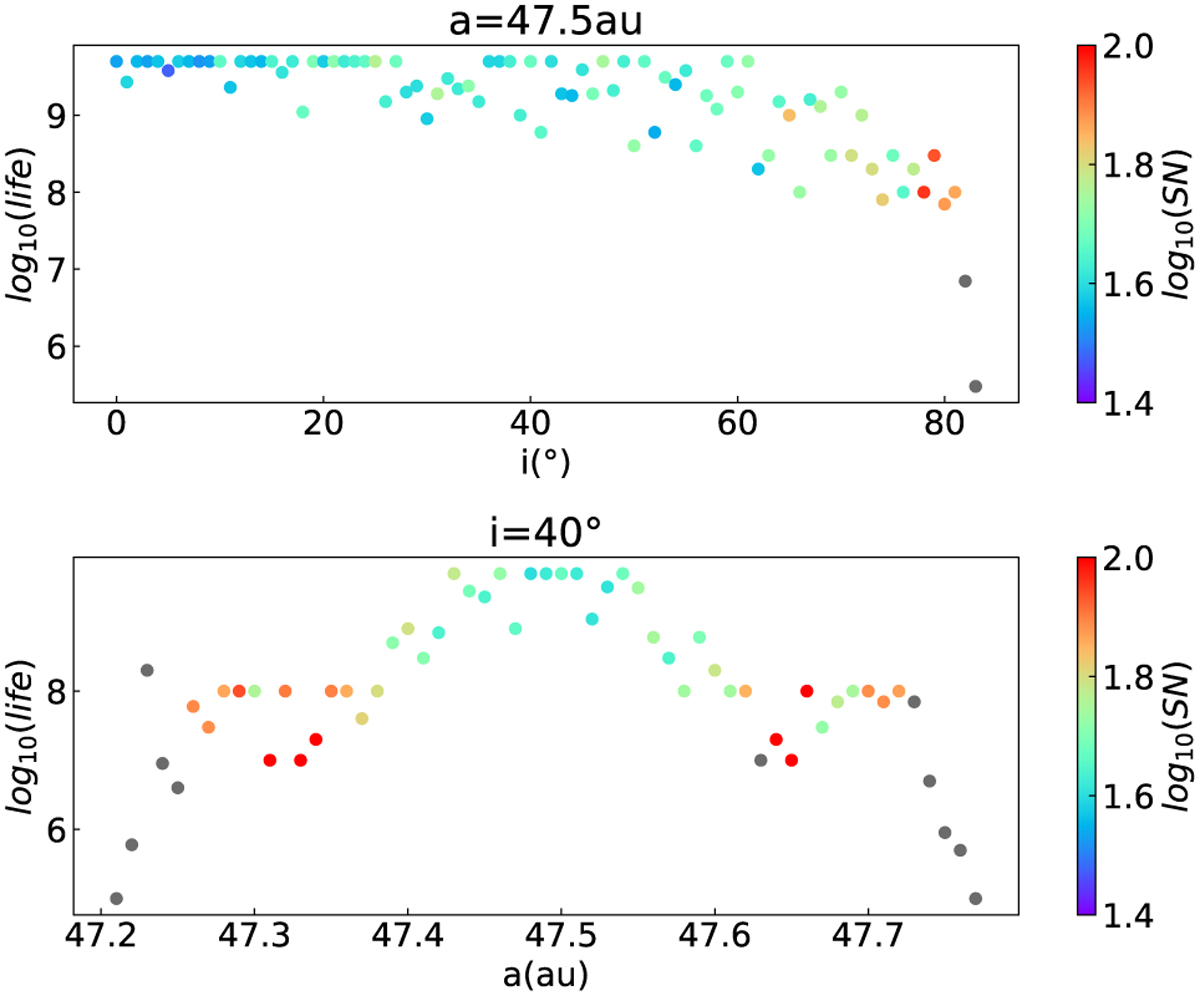
Lifetime and SN of test particles. Initial conditions are selected from two cross lines in the (a, i) plane, one with fixed a (top) and the other with fixed i (bottom). The colour indicates the value of SN, with those gray dots representing those orbits that are destabilized within the 34 Myr’s integration; therefore, the SN cannot be calculated, but the lifetime can still be calculated.
Current usage metrics show cumulative count of Article Views (full-text article views including HTML views, PDF and ePub downloads, according to the available data) and Abstracts Views on Vision4Press platform.
Data correspond to usage on the plateform after 2015. The current usage metrics is available 48-96 hours after online publication and is updated daily on week days.
Initial download of the metrics may take a while.