Fig. 3
Download original image
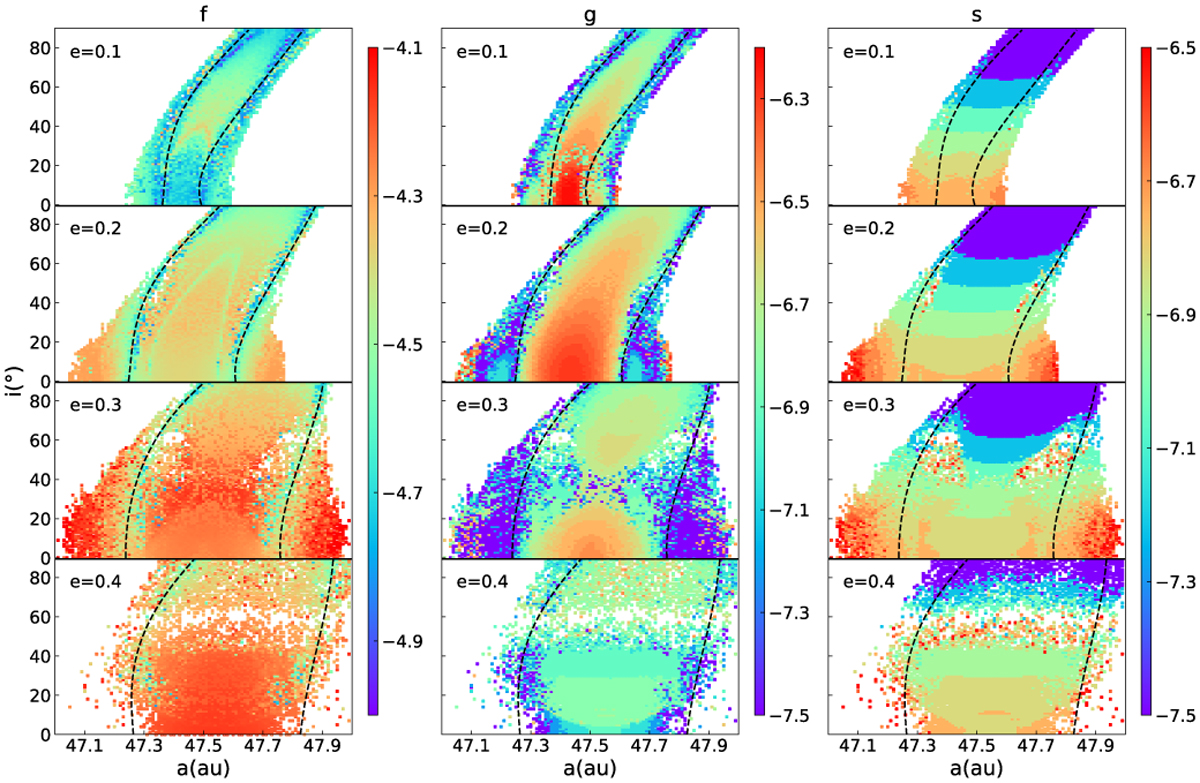
Proper frequencies of test particles’ motion in the 1:2 MMR on (a, i) plane. From left to right, the panels show the proper frequencies of the resonance angle (f), of perihelion (𝑔), and of ascending node (s), respectively. From top to bottom, test particles have increasing initial eccentricities, from 0.1 to 0.4, as labelled in each panel. The colour indicates the logarithm of the proper frequency in 2π yr−1. The black lines mark the boundary between the horseshoe and asymmetric resonance islands. In between the lines are the asymmetric resonance island. In the blank area, orbits initialised there are unstable and cannot survive the orbital integration of ~34 Myr.
Current usage metrics show cumulative count of Article Views (full-text article views including HTML views, PDF and ePub downloads, according to the available data) and Abstracts Views on Vision4Press platform.
Data correspond to usage on the plateform after 2015. The current usage metrics is available 48-96 hours after online publication and is updated daily on week days.
Initial download of the metrics may take a while.