Fig. 11
Download original image
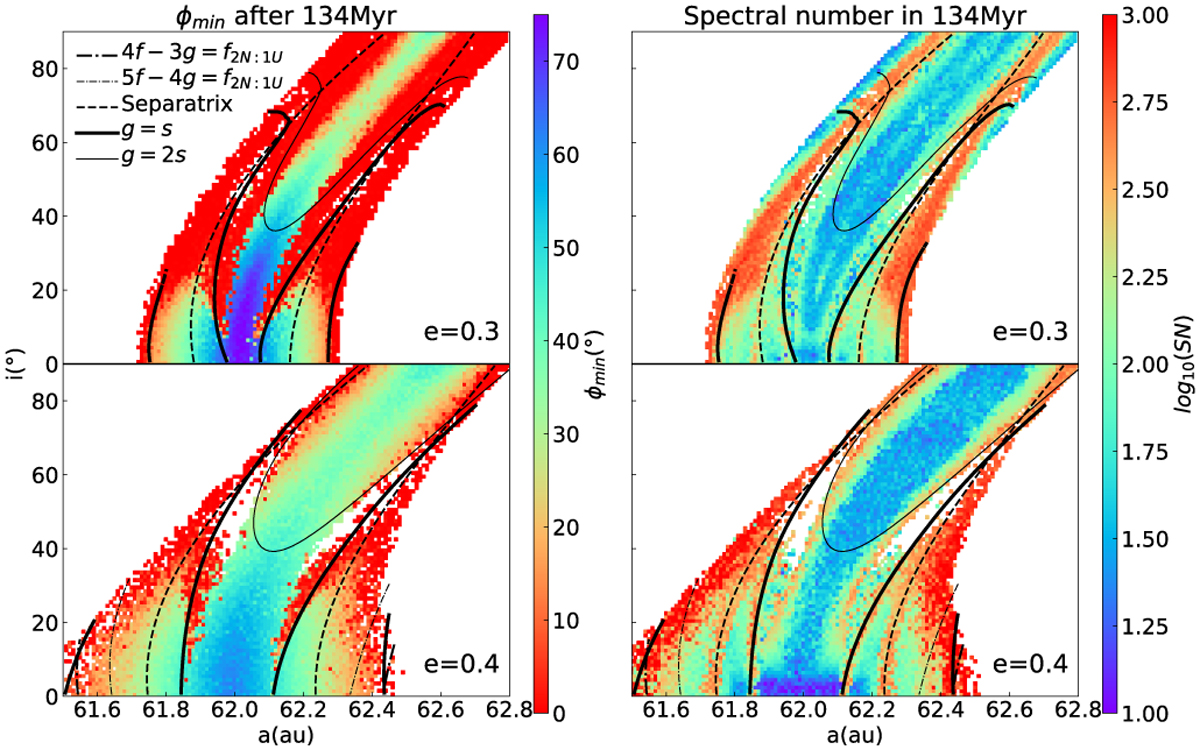
Dynamical maps of the 1:3 resonance on the (a, i) plane. Two indicators, the ϕmin (left column) and the SN (right column) have been adopted. Two initial eccentricity values, e = 0.3 (top panels) and e = 0.4 (bottom panels), have been used to indicate the stability of orbits. Recognised secular mechanisms and the separatrix between the horseshoe and asymmetric resonances are plotted as lines.
Current usage metrics show cumulative count of Article Views (full-text article views including HTML views, PDF and ePub downloads, according to the available data) and Abstracts Views on Vision4Press platform.
Data correspond to usage on the plateform after 2015. The current usage metrics is available 48-96 hours after online publication and is updated daily on week days.
Initial download of the metrics may take a while.