Open Access
Fig. 9.
Download original image
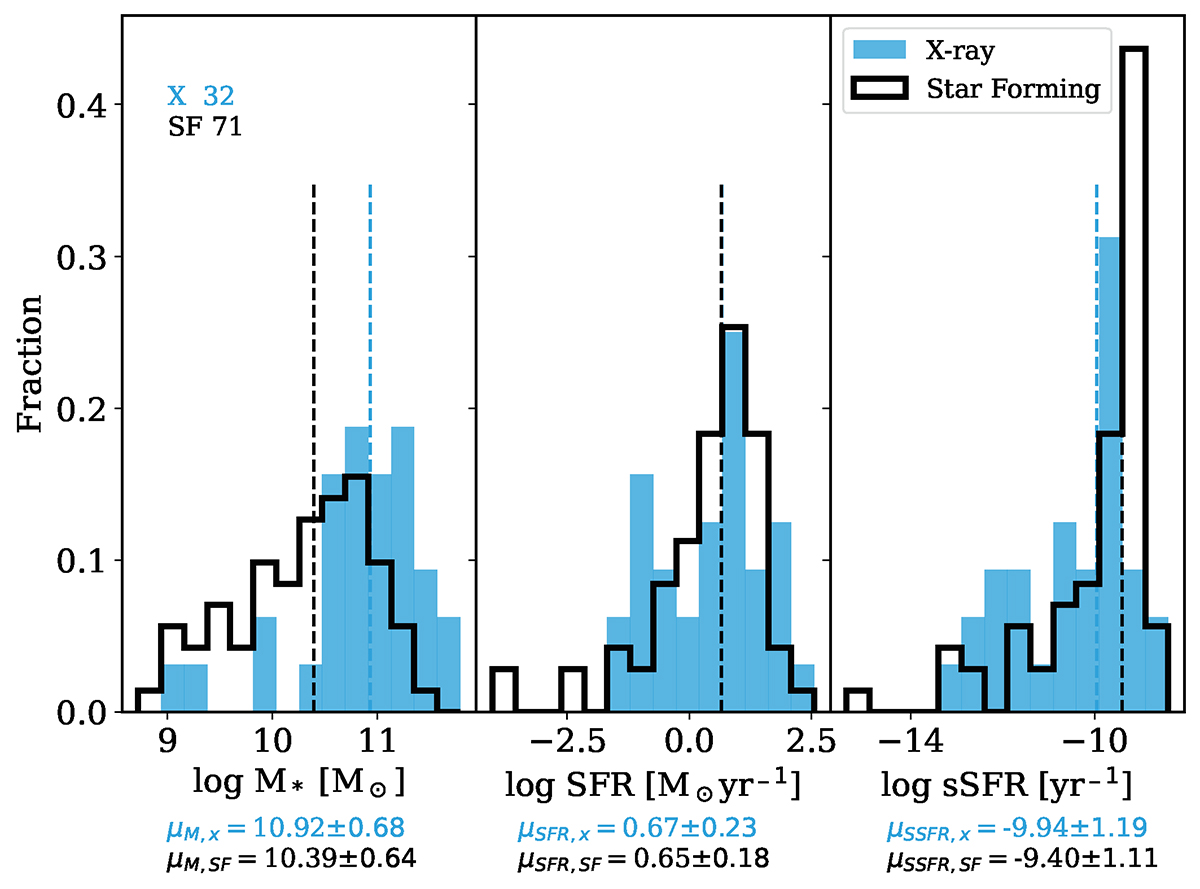
Distribution of the estimated stellar mass (left), SFR (center), and sSFR (right) for the X-ray AGN (blue), and SF (black) populations. The median values for each population are indicated by the vertical lines, and the corresponding values along with their associated errors are shown on the plot.
Current usage metrics show cumulative count of Article Views (full-text article views including HTML views, PDF and ePub downloads, according to the available data) and Abstracts Views on Vision4Press platform.
Data correspond to usage on the plateform after 2015. The current usage metrics is available 48-96 hours after online publication and is updated daily on week days.
Initial download of the metrics may take a while.