Fig. 7.
Download original image
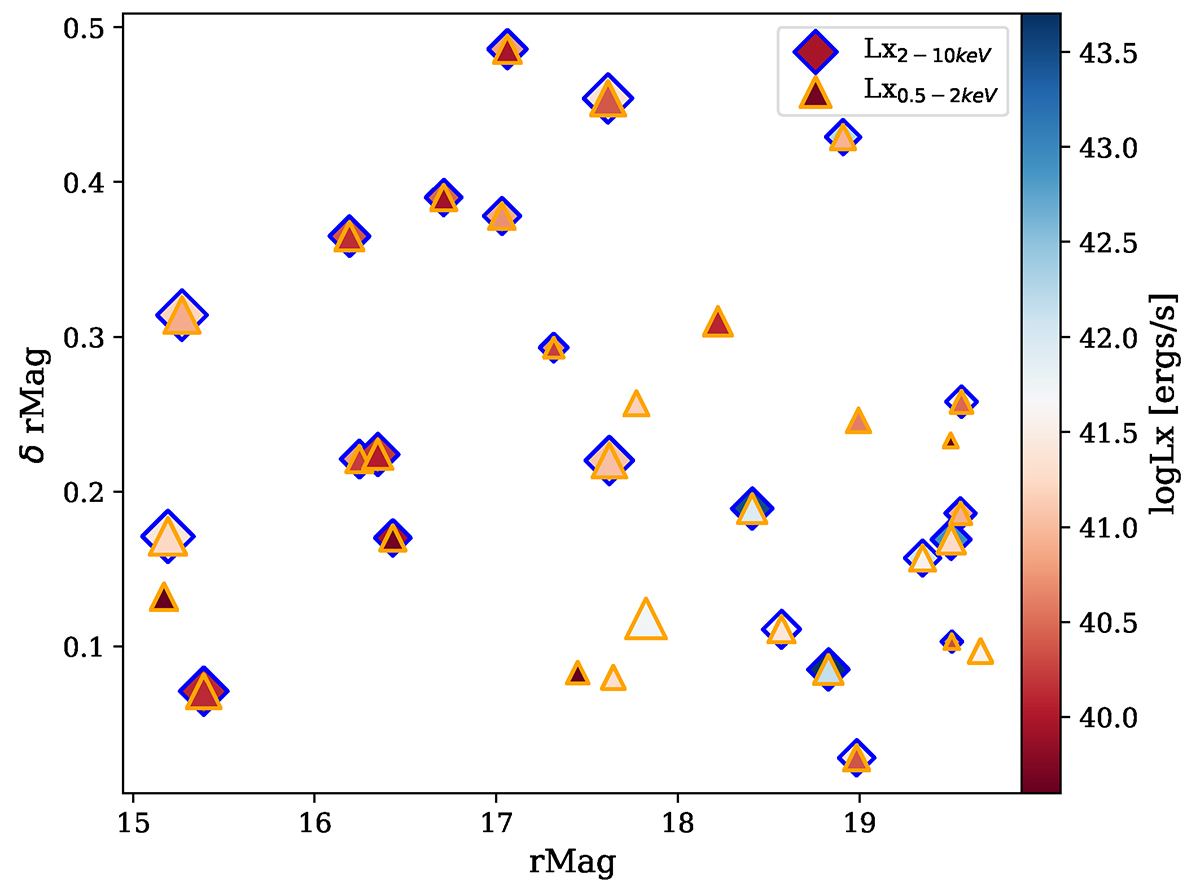
Scatter plot showing the difference in the r-band magnitude of AGN host galaxies before and after the removal of the AGN contribution. The points in the soft and hard bands are color-coded based on their X-ray luminosity. The size of the points is relative to the physical size of the host galaxies. The plot shows the impact of AGN in the observed magnitudes of galaxies. However, we do not see any correlation between the δ rMag and rMag or Lx of the AGN hosts.
Current usage metrics show cumulative count of Article Views (full-text article views including HTML views, PDF and ePub downloads, according to the available data) and Abstracts Views on Vision4Press platform.
Data correspond to usage on the plateform after 2015. The current usage metrics is available 48-96 hours after online publication and is updated daily on week days.
Initial download of the metrics may take a while.