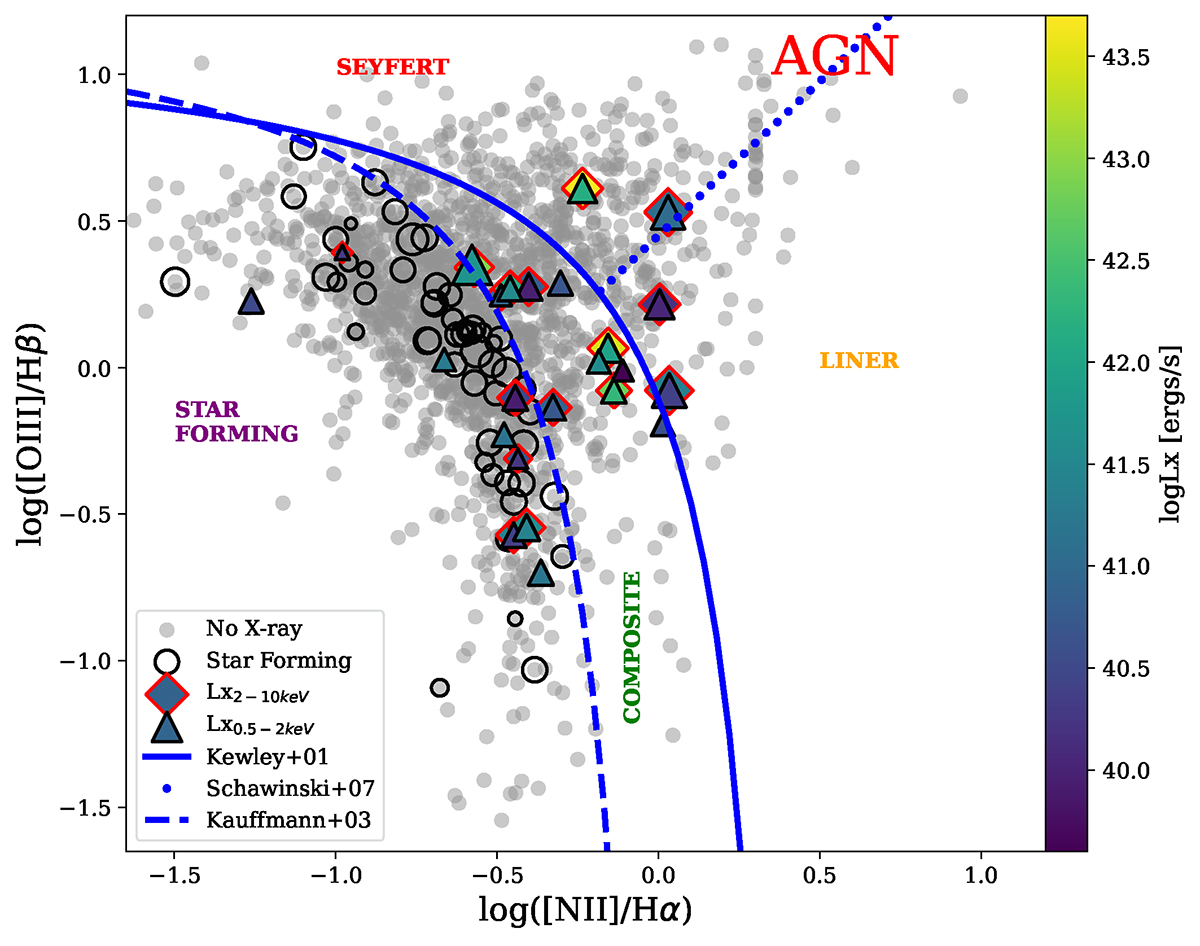
Fig. 5.
Download original image
BPT line diagnostic diagram of all the sources in our sample calculated from Martínez-Solaeche et al. (2021). The dashed blue line shows the SF line of Kauffmann et al. (2003), and the solid blue lines show the maximum starburst model from Kewley et al. (2001). All the objects between these lines are known to be SF-AGN composites or transition objects. The dotted line shows the demarcation line separating Seyferts and LINERs (Schawinski et al. 2007). The triangles show only soft (0.5–2 keV) X-ray-emitting galaxies, and the diamonds represent galaxies emitting both soft and hard (2–10 keV) X-ray fluxes. The gray points show all sources without X-ray emission, and the empty black circles below the dashed line show the SF sample. This figure also demonstrates the importance of selecting AGN using X-rays, as most of the AGN in our sample would have been identified as SF or composite galaxies if not for their X-ray detections.
Current usage metrics show cumulative count of Article Views (full-text article views including HTML views, PDF and ePub downloads, according to the available data) and Abstracts Views on Vision4Press platform.
Data correspond to usage on the plateform after 2015. The current usage metrics is available 48-96 hours after online publication and is updated daily on week days.
Initial download of the metrics may take a while.