Fig. B.1.
Download original image
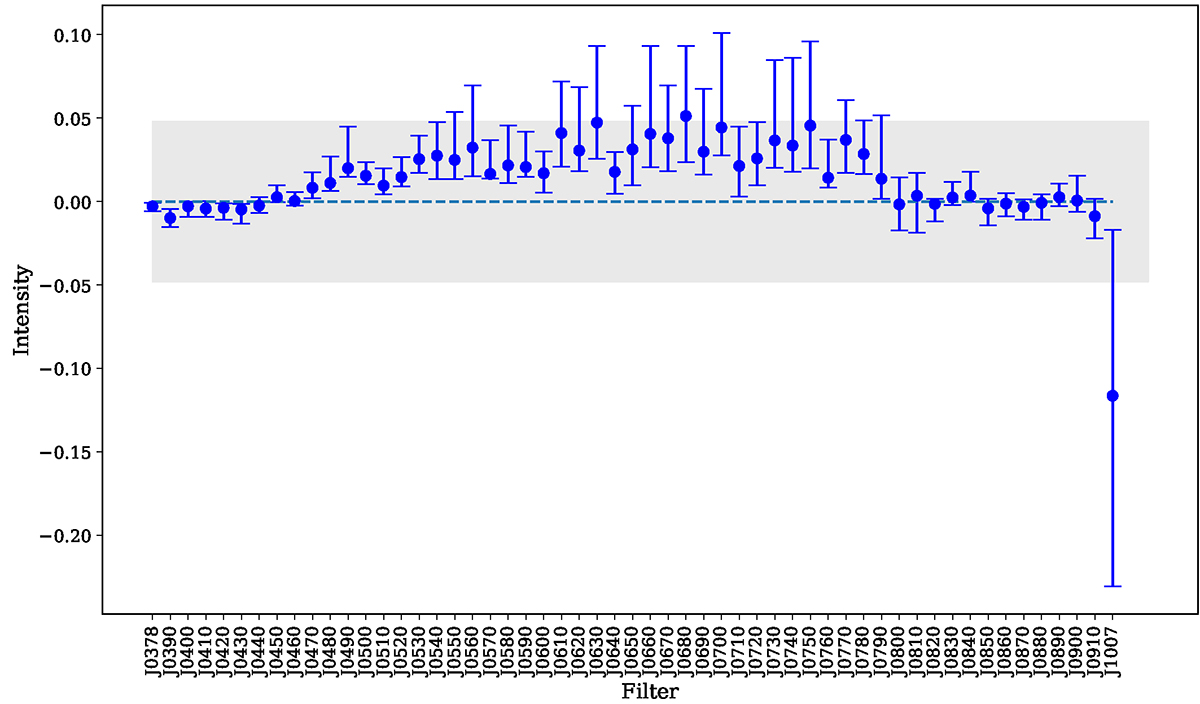
Average intensity of the residuals in the central bins of the AGN sample in each filter obtained after GALFITM modeling. The error bars show the 25th and 75th quantiles of the distribution, and the shaded gray region represents the standard deviation of the mean value. A horizontal dashed line is plotted at intensity = 0, where we would obtain a perfectly flat residual image.
Current usage metrics show cumulative count of Article Views (full-text article views including HTML views, PDF and ePub downloads, according to the available data) and Abstracts Views on Vision4Press platform.
Data correspond to usage on the plateform after 2015. The current usage metrics is available 48-96 hours after online publication and is updated daily on week days.
Initial download of the metrics may take a while.