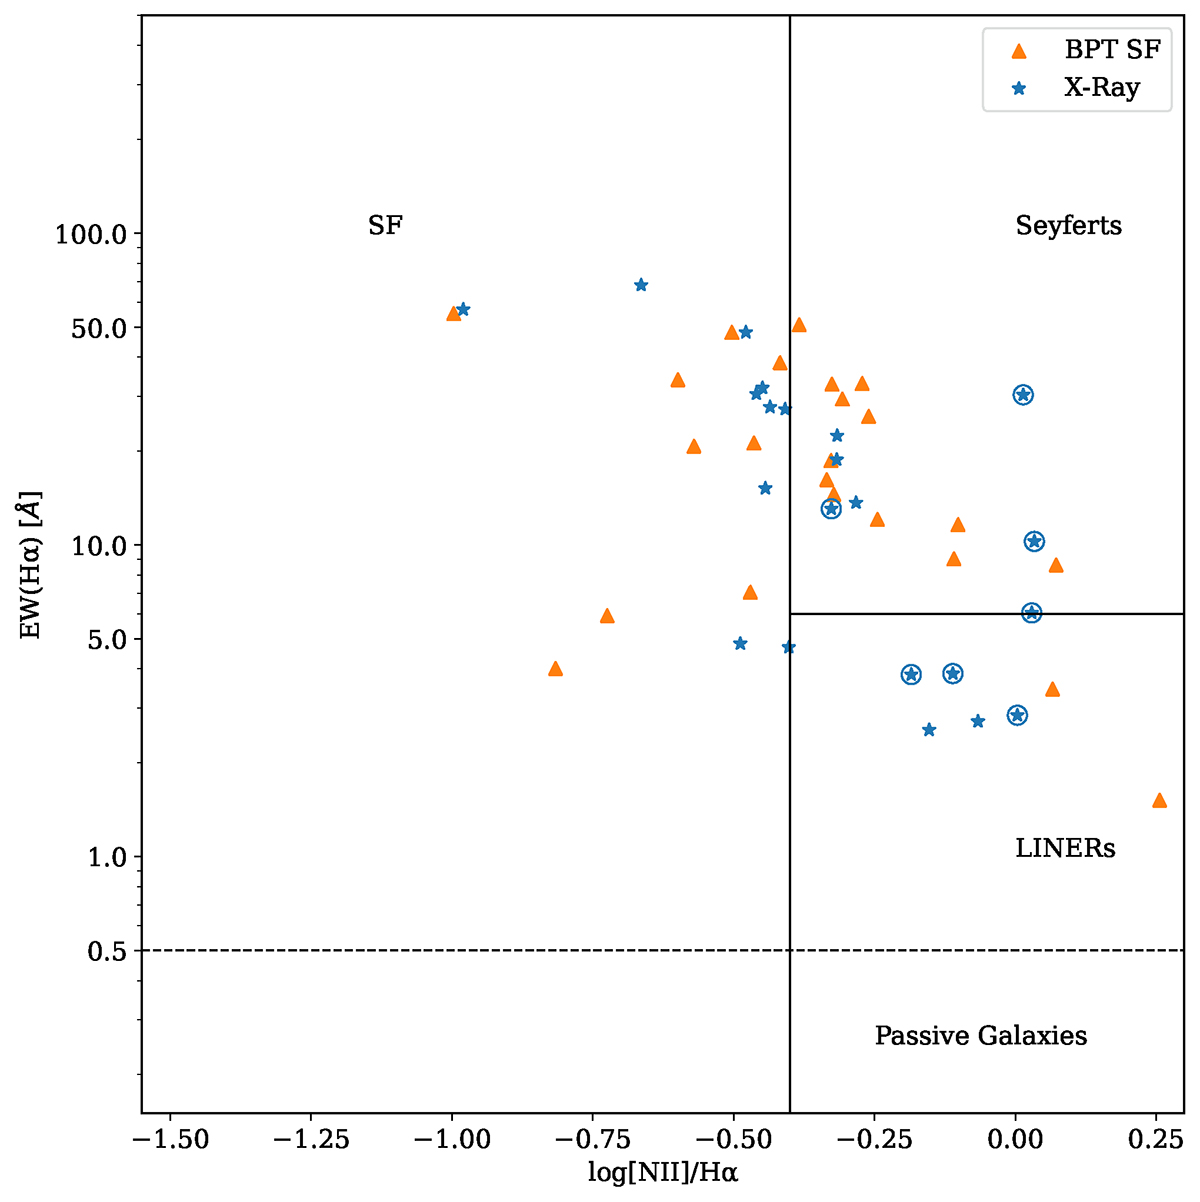
Fig. A.1.
Download original image
WHAN diagram used to subdivide our mass-matched SF and AGN samples into various categories. All the objects to the left of -0.6 log[NII]/Hα are SF galaxies, and those below 0.5 Hα in the y-axis are considered to be passive. Galaxies above 0.5 Å EW(Hα) and to the right of -0.6 log[NII]/Hα are considered to be AGN (Cid Fernandes et al. 2011). The blue circles show the X-ray galaxies identified as AGN in both the BPT and WHAN diagrams.
Current usage metrics show cumulative count of Article Views (full-text article views including HTML views, PDF and ePub downloads, according to the available data) and Abstracts Views on Vision4Press platform.
Data correspond to usage on the plateform after 2015. The current usage metrics is available 48-96 hours after online publication and is updated daily on week days.
Initial download of the metrics may take a while.