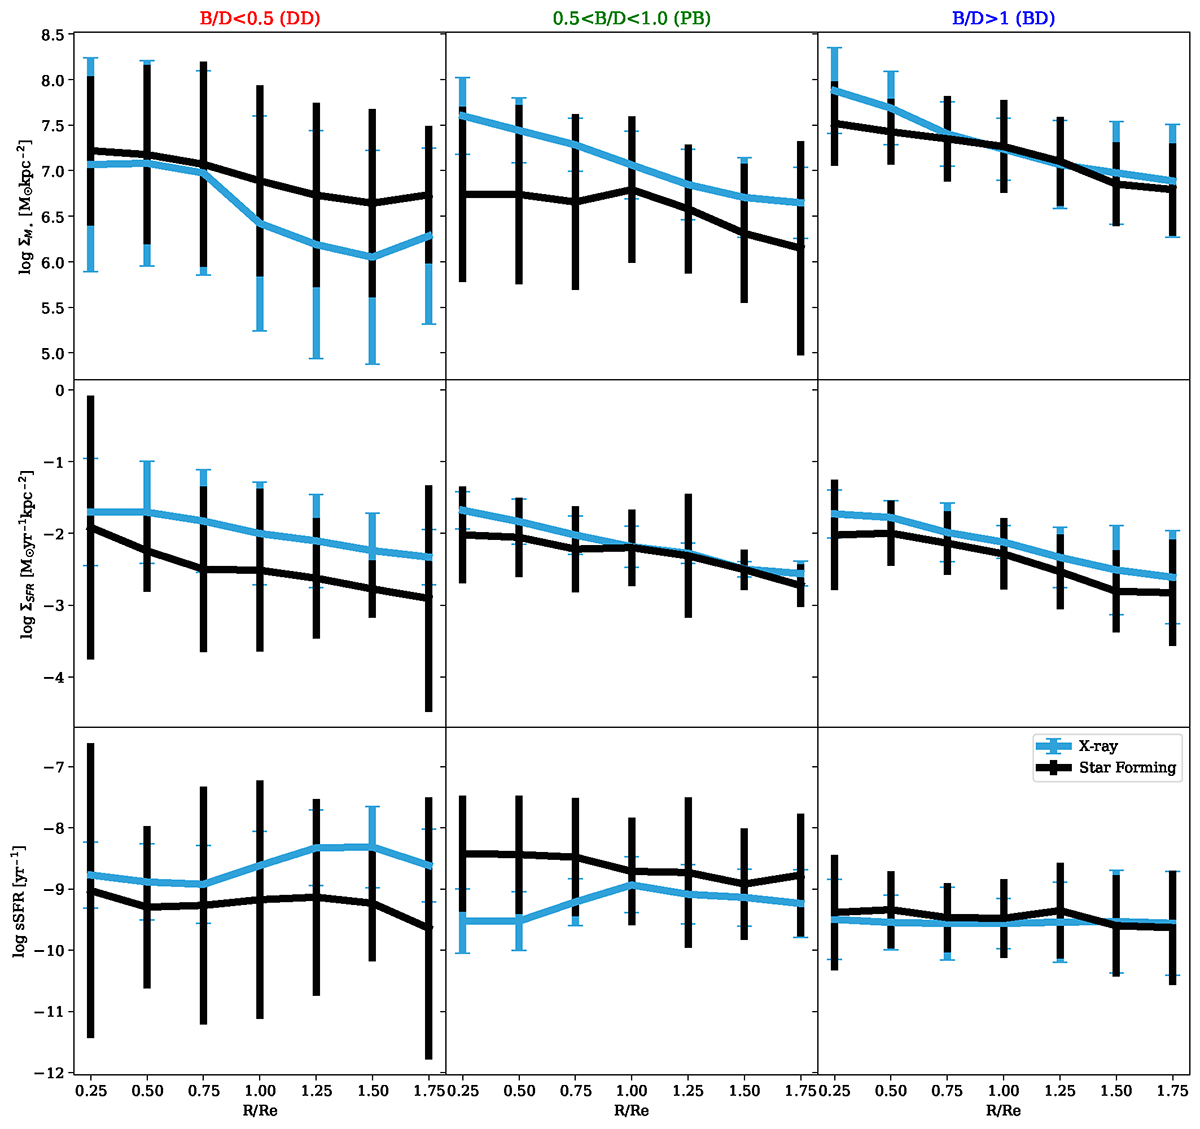
Fig. 14.
Download original image
Radial profiles of the ΣM⋆, ΣSFR, and sSFR of the AGN and SF samples, sub-sampled on the basis of B/D. The higher the B/D ratio, the more dominant the bulge is in a galaxy. Both samples exhibit decreasing ΣM⋆ and ΣSFR profiles (top two rows). In DD and PB systems, AGN seem to demonstrate a increasing sSFR profile up to 1Re whereas the profiles are flat for both samples in BD galaxies (bottom row). Error bars represent the 3σ confidence intervals.
Current usage metrics show cumulative count of Article Views (full-text article views including HTML views, PDF and ePub downloads, according to the available data) and Abstracts Views on Vision4Press platform.
Data correspond to usage on the plateform after 2015. The current usage metrics is available 48-96 hours after online publication and is updated daily on week days.
Initial download of the metrics may take a while.