Fig. 13.
Download original image
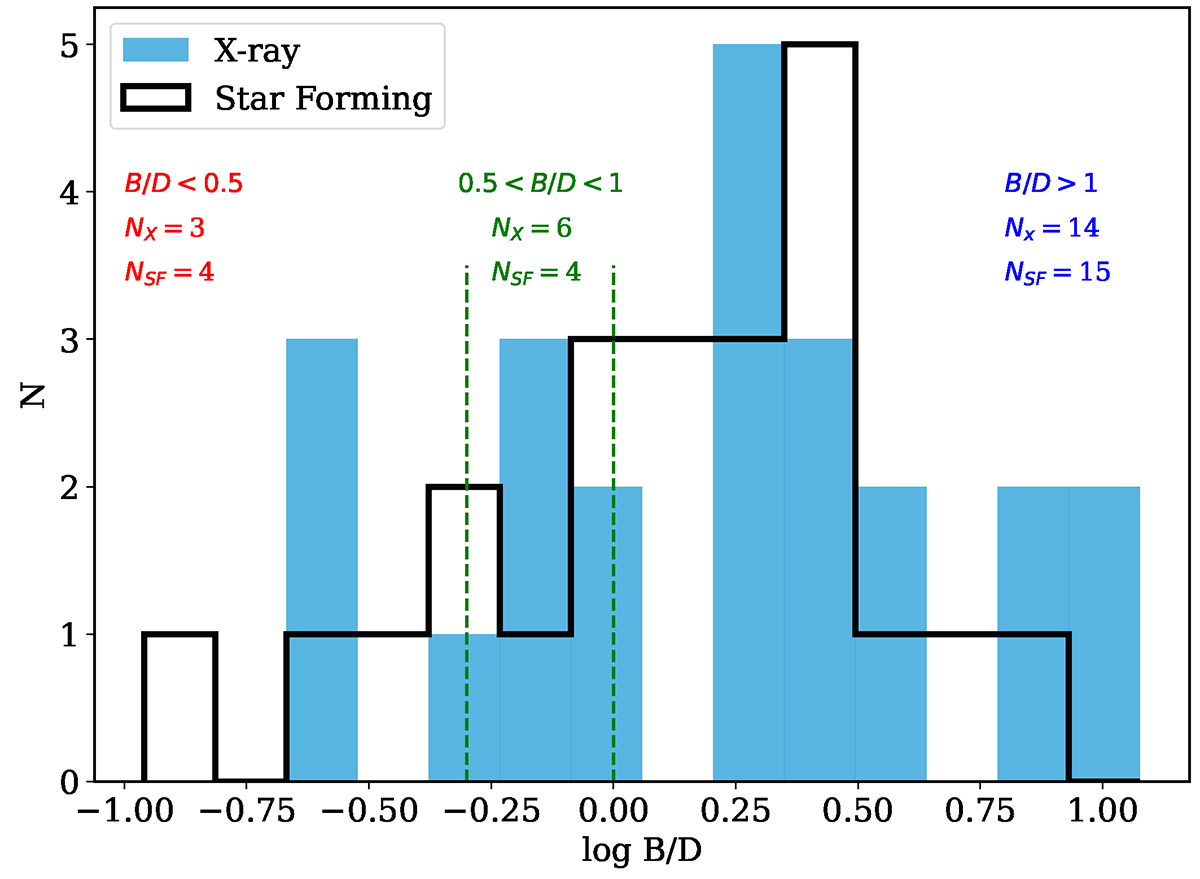
Distribution of log B/D for the AGN and SF samples, shown as blue and black histograms, respectively, for the mass-matched samples. The vertical dashed green lines show the boundaries of the morphological bins. The numbers of objects in the samples with B/D < 0.5, 0.5 < B/D < 1, and B/D > 1 are displayed in red (left), green (center), and blue (right), respectively.
Current usage metrics show cumulative count of Article Views (full-text article views including HTML views, PDF and ePub downloads, according to the available data) and Abstracts Views on Vision4Press platform.
Data correspond to usage on the plateform after 2015. The current usage metrics is available 48-96 hours after online publication and is updated daily on week days.
Initial download of the metrics may take a while.