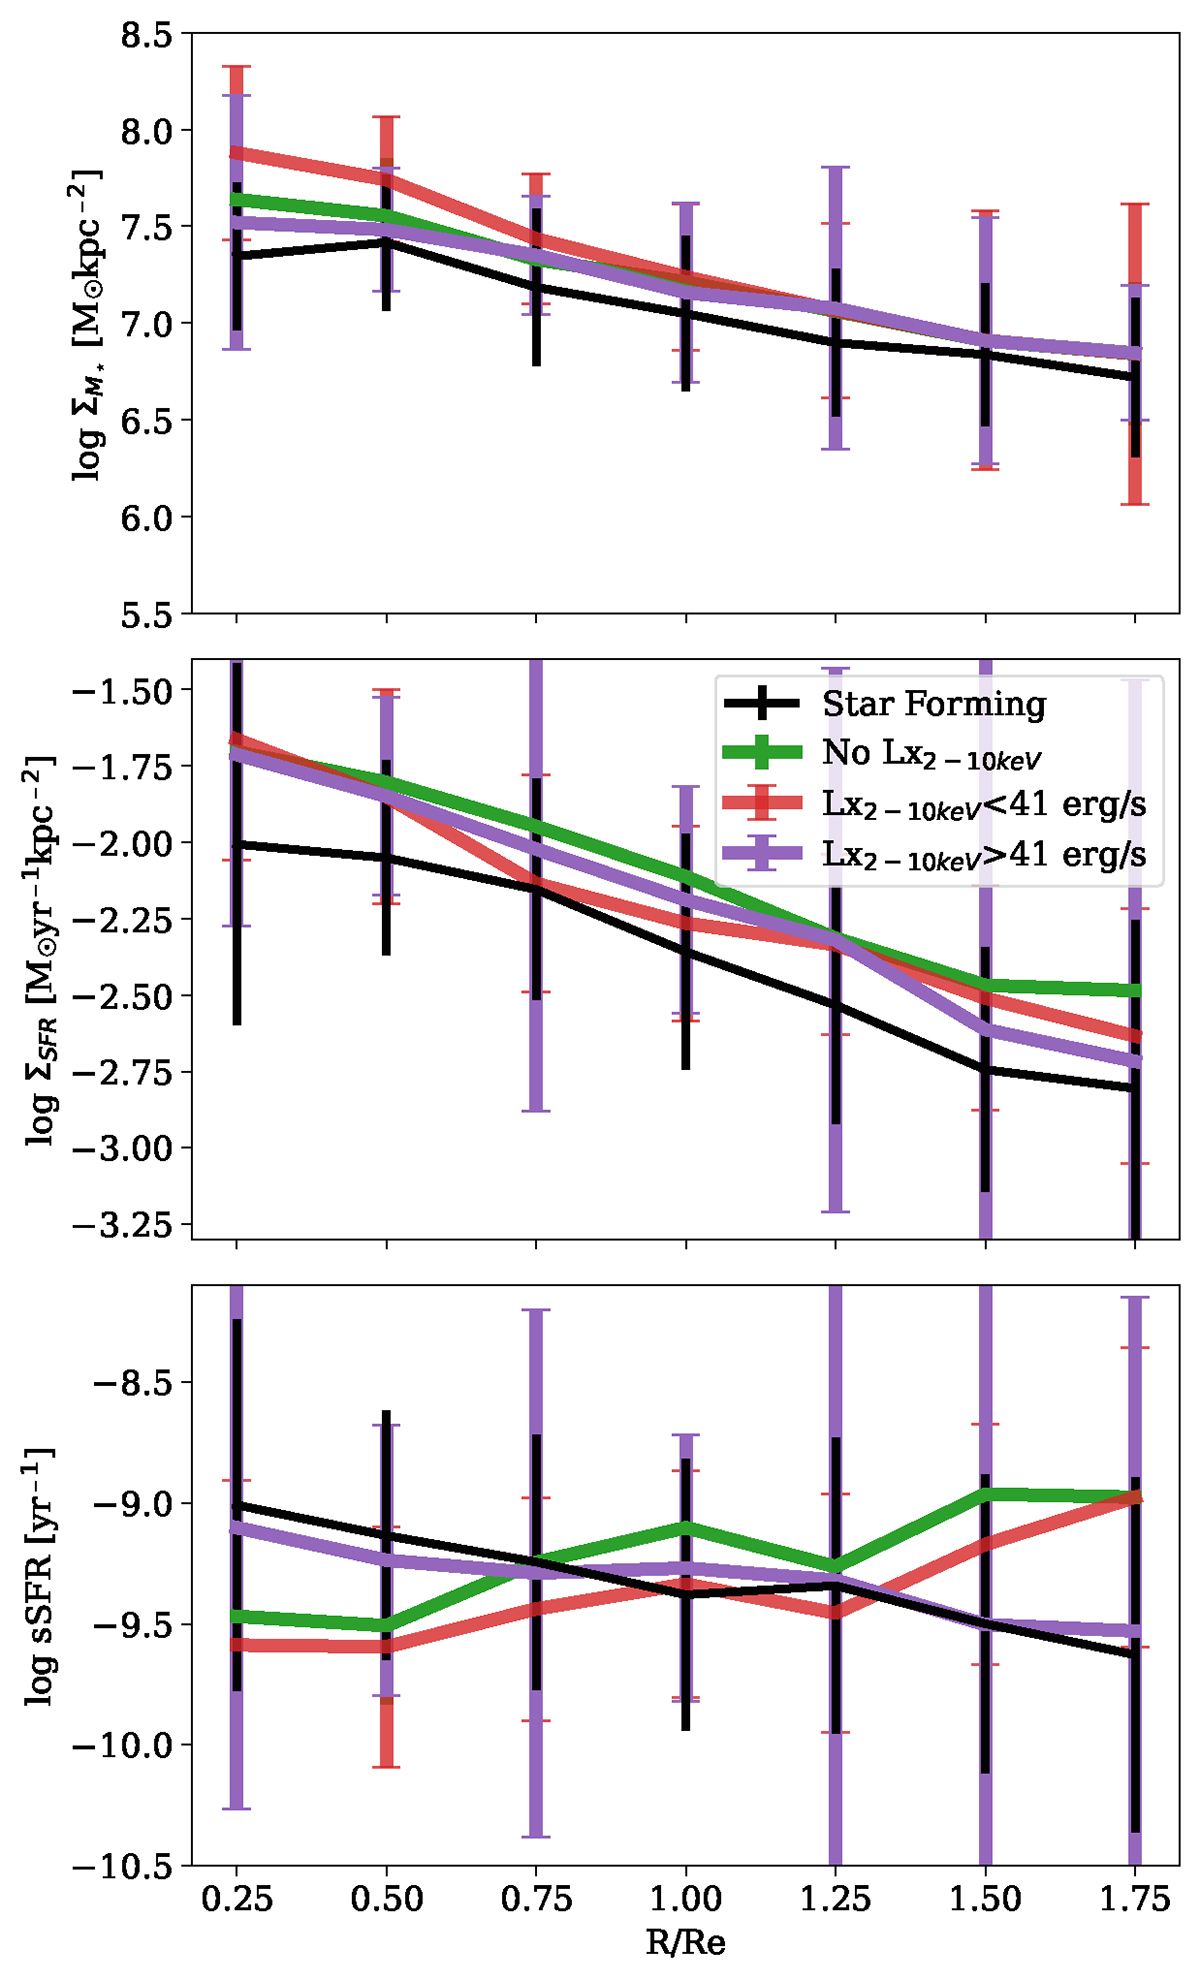
Fig. 12.
Download original image
Radial variation in the ΣM⋆ (top), ΣSFR (middle), and sSFR (bottom) of strong and weak AGN based on their X-ray strength compared to the SF sample. The profiles of strong X-ray AGN with log Lx2 − 10 keV > 41 erg s−1 are shown with purple lines, moderate X-ray AGN with log Lx2 − 10 keV < 41 erg s−1 with red lines, and AGN without Lx2 − 10 keV detection with green lines. The profiles of SF samples are shown with black lines. This figure shows that strong X-ray AGN exhibit a profile similar to that of the SF sample, whereas weaker X-ray AGN show signs of quenching in the center and enhancement in the outer region of galaxies. Error bars represent the 3σ confidence intervals.
Current usage metrics show cumulative count of Article Views (full-text article views including HTML views, PDF and ePub downloads, according to the available data) and Abstracts Views on Vision4Press platform.
Data correspond to usage on the plateform after 2015. The current usage metrics is available 48-96 hours after online publication and is updated daily on week days.
Initial download of the metrics may take a while.