Fig. 9
Download original image
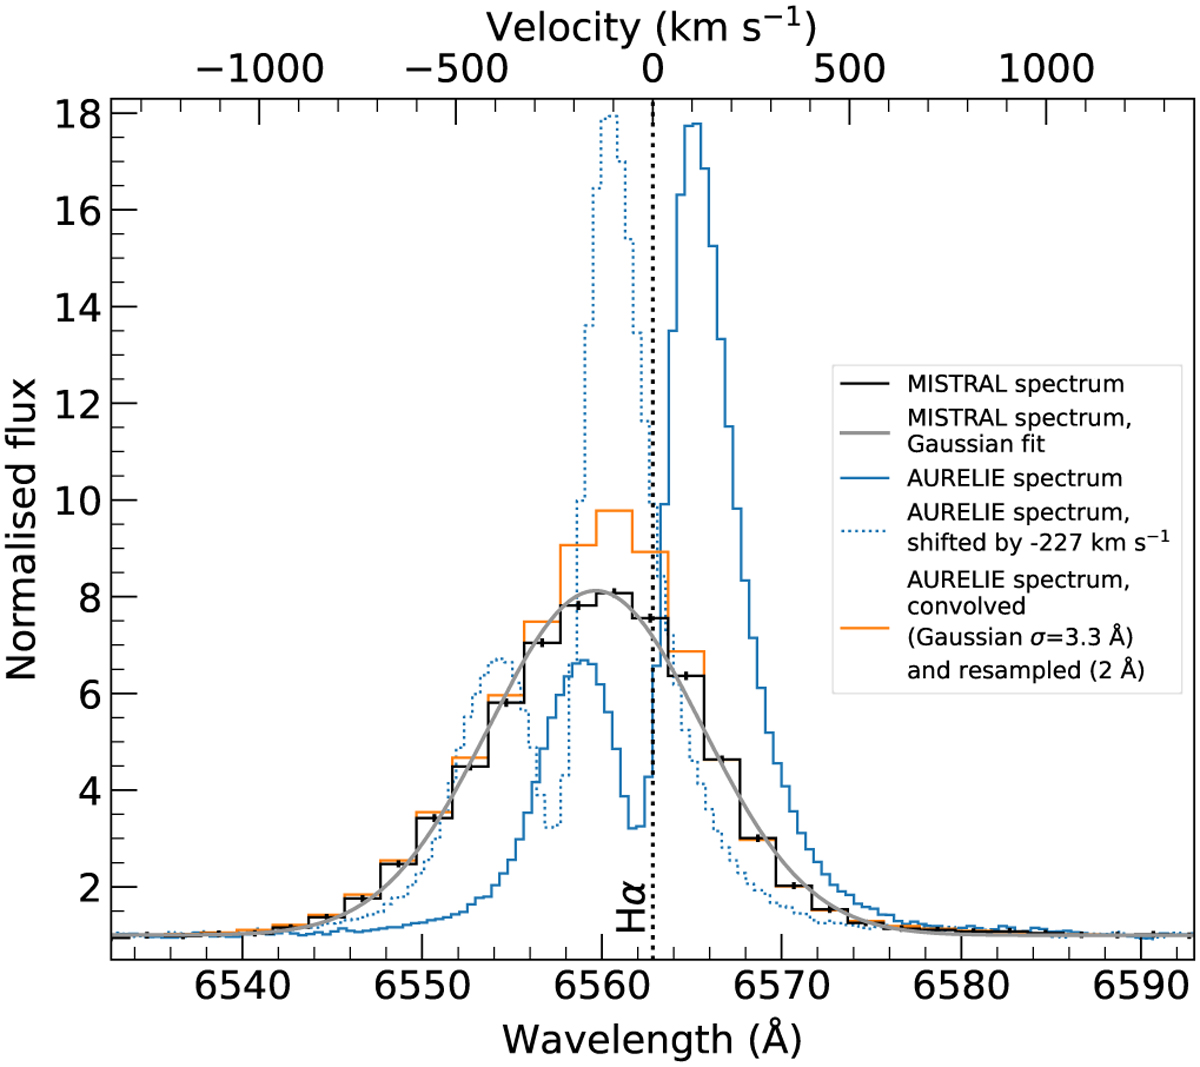
Broad and variable Нα emission line from LkHα 324SE. The black data with error bars are the normalized MISTRAL spectrum. The gray line is the Gaussian fit of the emission line. The solid blue line is the medium-resolution (R ~ 5000) spectrum obtained 12 days after the MISTRAL observations, with the OHP 1.52 m telescope with the AURELIE spectrograph. The dotted blue line shows the same spec trum shifted by −227 km s−1 to match the position of the emission line observed with MISTRAL. The orange line is the convolved (Gaussian with σ = 3.3 Å) and resampled (2 Å spectral bins) AURELIE spectrum to match the spectral resolution and sampling of MISTRAL.
Current usage metrics show cumulative count of Article Views (full-text article views including HTML views, PDF and ePub downloads, according to the available data) and Abstracts Views on Vision4Press platform.
Data correspond to usage on the plateform after 2015. The current usage metrics is available 48-96 hours after online publication and is updated daily on week days.
Initial download of the metrics may take a while.