Open Access
Fig. 8
Download original image
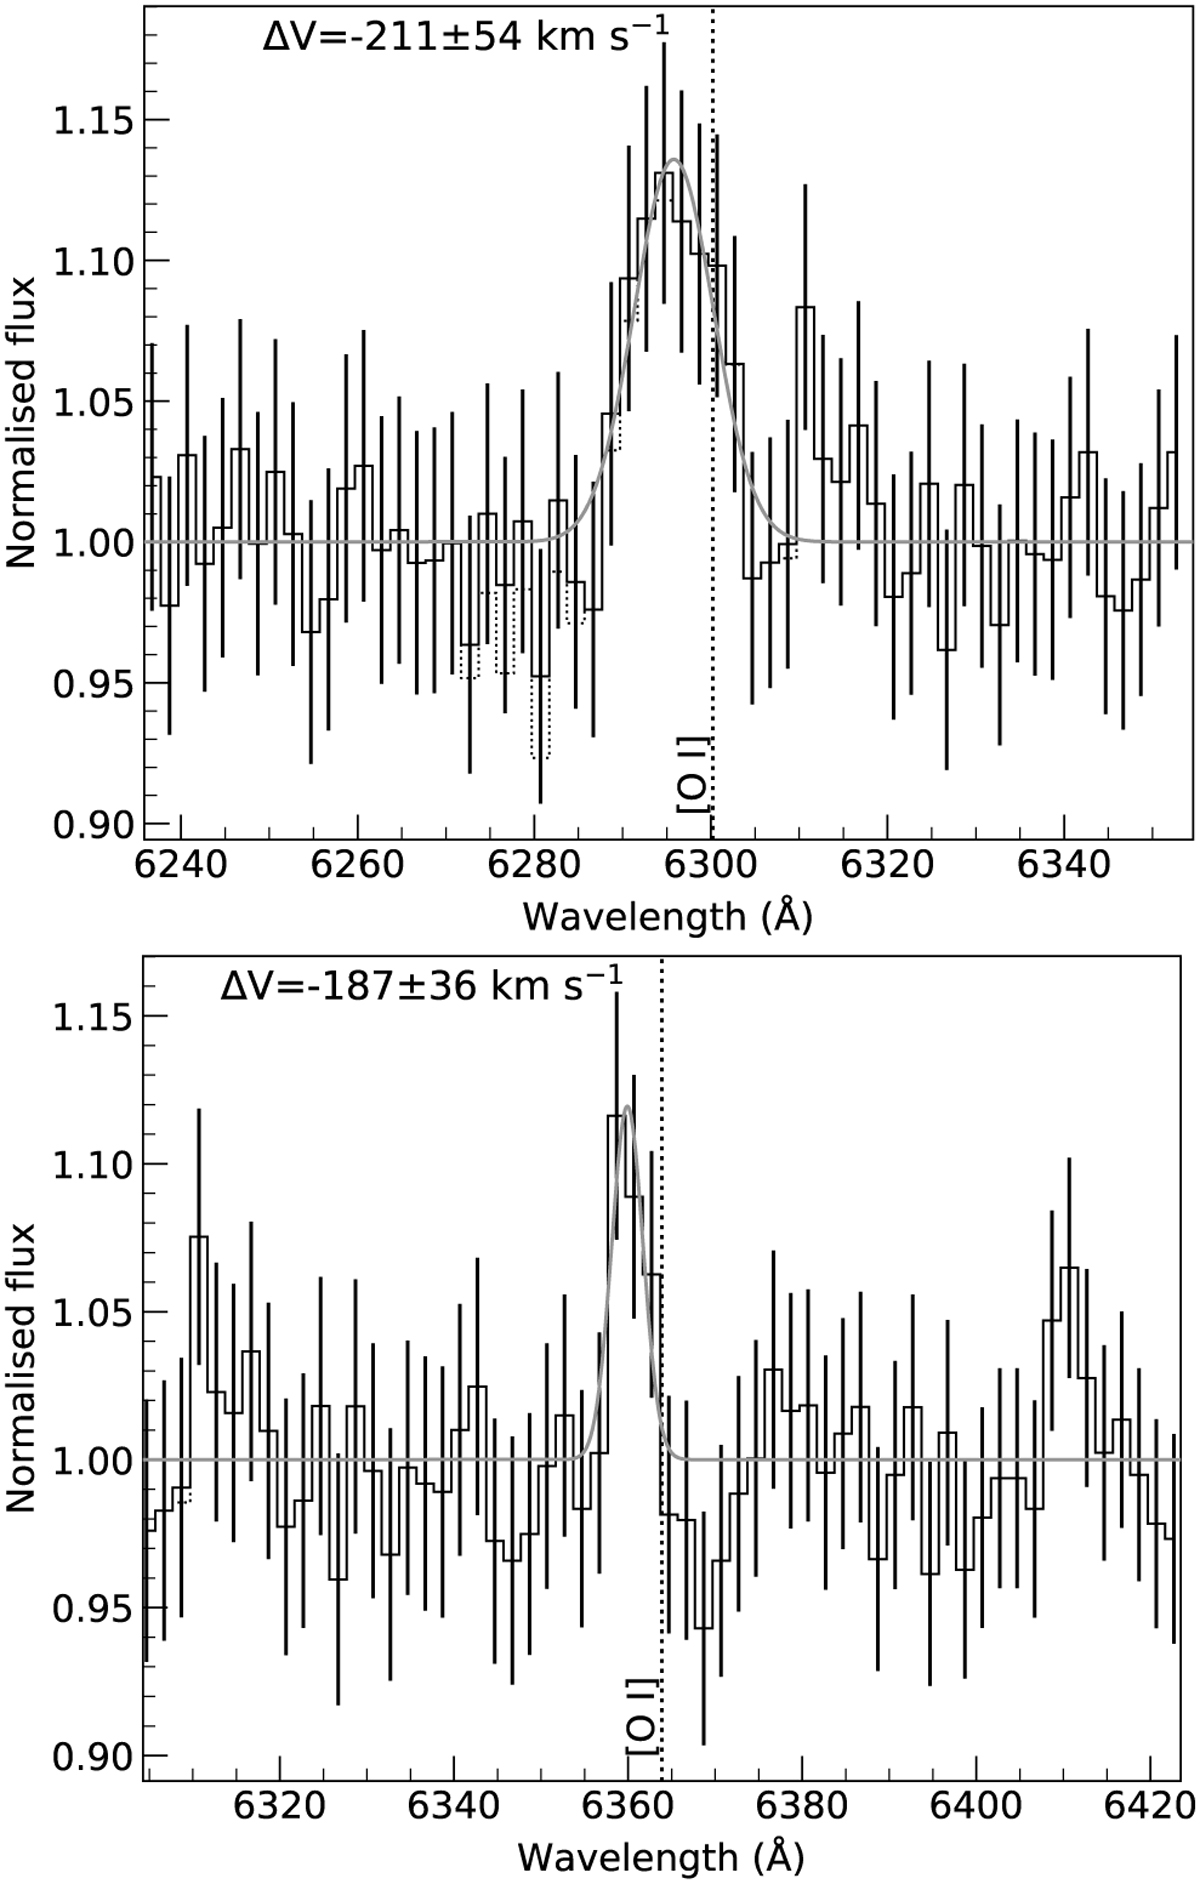
Faint blueshiſted [O I] emission lines from LkHα 324SE. The dotted step line in the top panel shows the normalized spectrum without correction of the atmospheric O2 γ band. The gray line is the Gaussian fit. The quoted error of the velocity shift includes the wavelength cali bration error in quadrature.
Current usage metrics show cumulative count of Article Views (full-text article views including HTML views, PDF and ePub downloads, according to the available data) and Abstracts Views on Vision4Press platform.
Data correspond to usage on the plateform after 2015. The current usage metrics is available 48-96 hours after online publication and is updated daily on week days.
Initial download of the metrics may take a while.