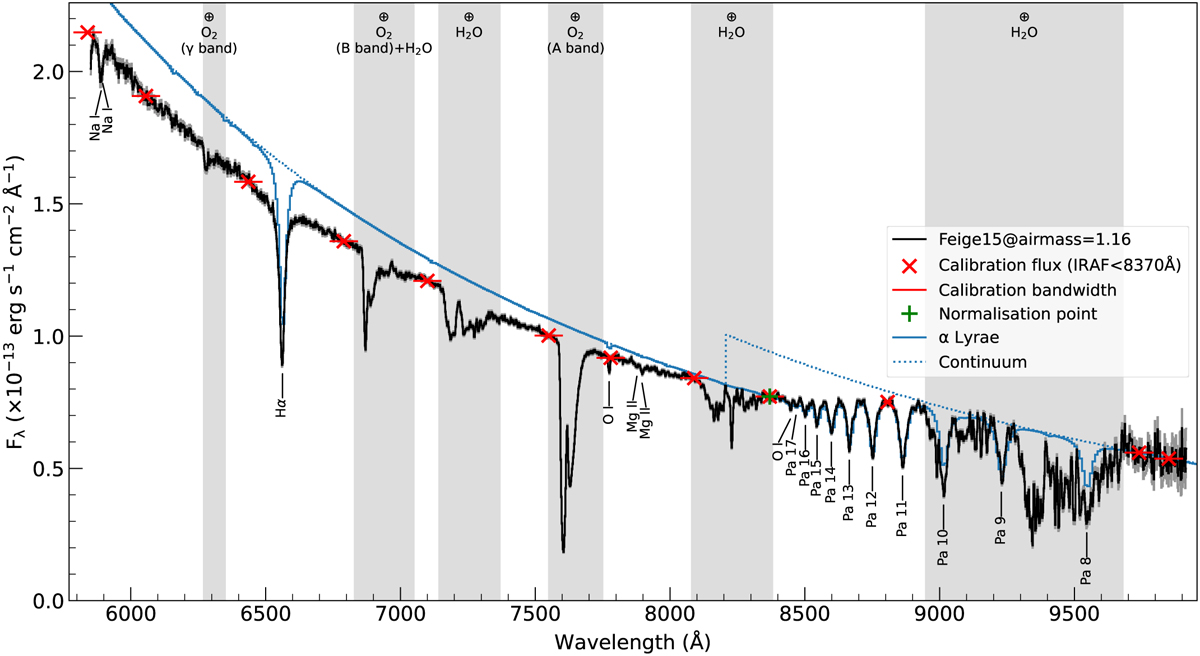
Fig. D.1
Download original image
Red configuration spectrum of the spectrophotometry standard Feige 15 with MISTRAL, obtained with an exposure of 600 s on the night of 8 December 2021 (no telluric correction). The flux error bars are plotted in gray. The vertical light-gray stripes indicate the atmospheric absorption bands of water and molecular oxygen (Lu et al. 2021). The reference flux and bandwidth wavelengths are marked in red (Stone 1977, shortward of 8370 Å). The solid and dotted blue lines are the α Lyrae (Vega) CALSPEC spectrum and continuum (Bohlin et al. 2014), respectively, normalized at the wavelength and flux marked by the green plus.
Current usage metrics show cumulative count of Article Views (full-text article views including HTML views, PDF and ePub downloads, according to the available data) and Abstracts Views on Vision4Press platform.
Data correspond to usage on the plateform after 2015. The current usage metrics is available 48-96 hours after online publication and is updated daily on week days.
Initial download of the metrics may take a while.