Fig. C.1
Download original image
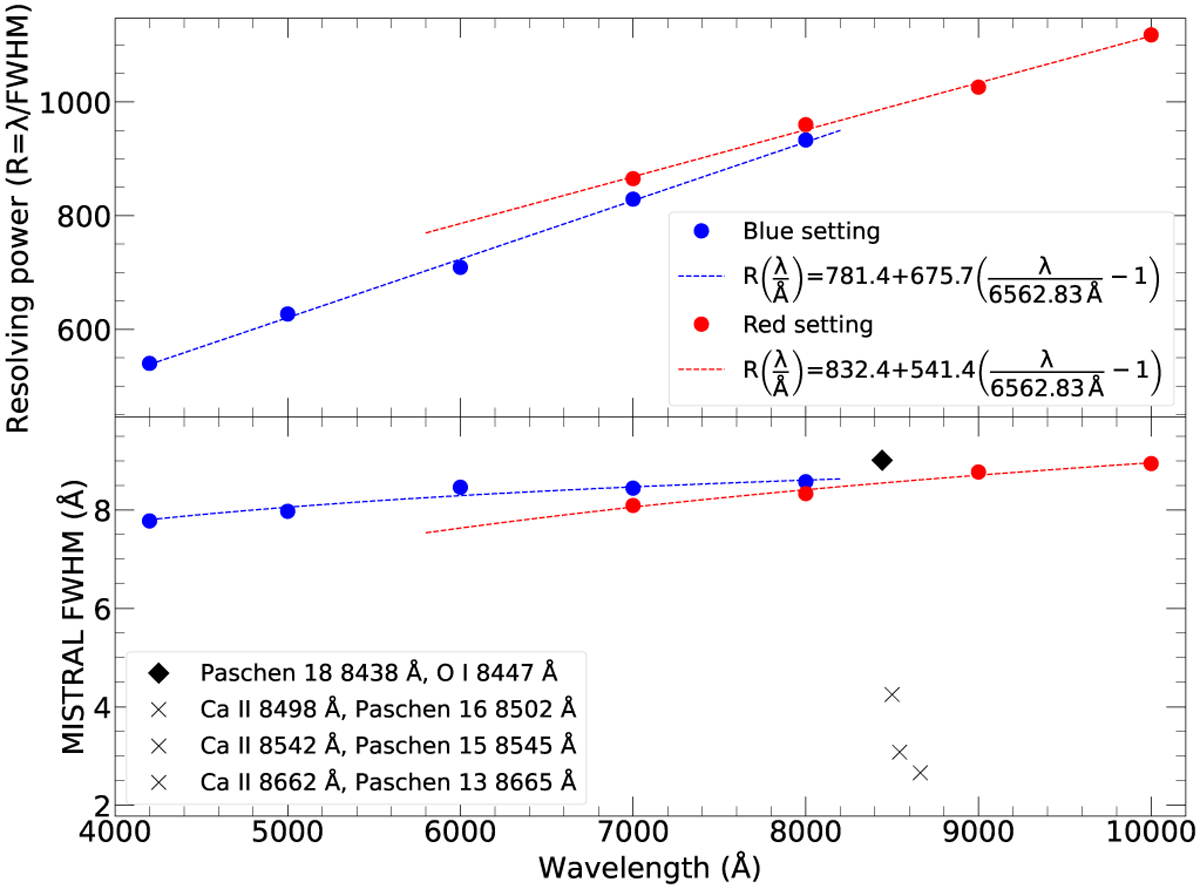
Theoretical spectral resolving power of MISTRAL. The data for the blue and red configurations are from Table C.1. Top panel: Resolving power vs. wavelength. The straight lines are the linear fitting of these data. Bottom panel: FWHM vs. wavelength. The curves are computed from the linear fits. For comparison, the wavelength separation of several close stellar emission lines is marked with a diamond (resolved with MISTRAL) and crosses (unresolved with MISTRAL).
Current usage metrics show cumulative count of Article Views (full-text article views including HTML views, PDF and ePub downloads, according to the available data) and Abstracts Views on Vision4Press platform.
Data correspond to usage on the plateform after 2015. The current usage metrics is available 48-96 hours after online publication and is updated daily on week days.
Initial download of the metrics may take a while.