Fig. 11
Download original image
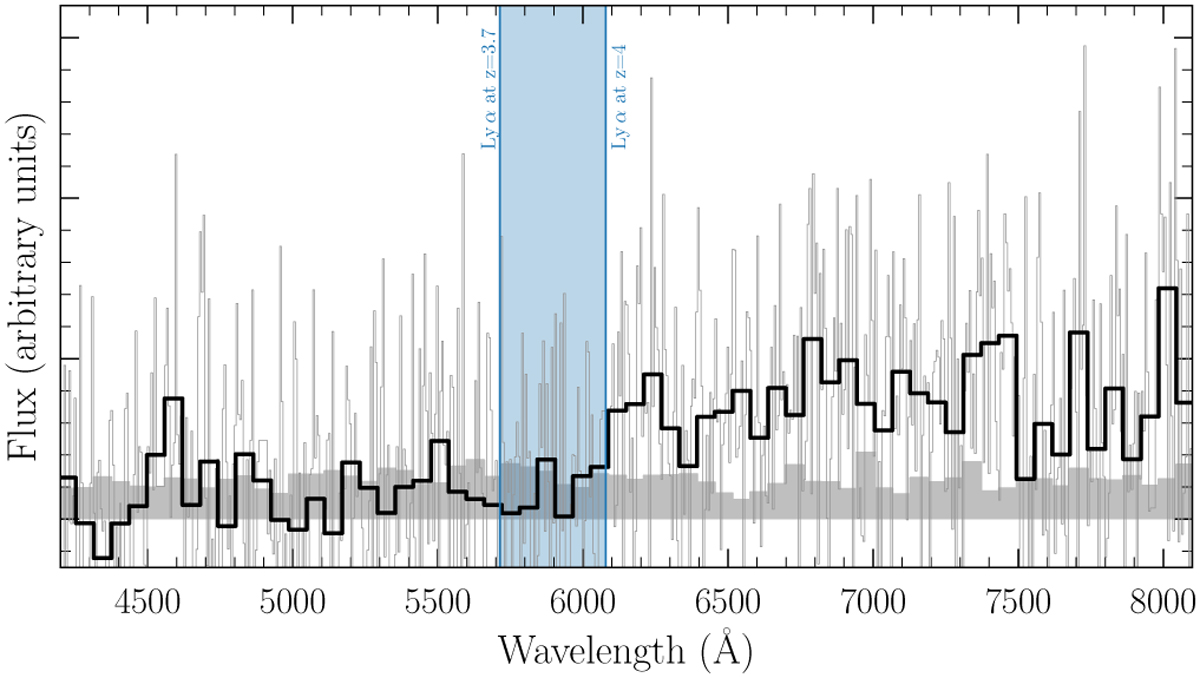
Spectrum of GRB230506C taken by MISTRAL (30 min exposure). The thin black curve represents the full spectrum, and the thick black curve represents the spectrum rebinned by 20 pixels. The gray shaded area represents the error spectrum. The center of the expected Ly α positions for z = 3.7 and z = 4 is shown as the vertical blue line. The blue shaded area represents the possible values of the Ly α centroid, assuming that the drop at 6100 A is due to the Lyman break.
Current usage metrics show cumulative count of Article Views (full-text article views including HTML views, PDF and ePub downloads, according to the available data) and Abstracts Views on Vision4Press platform.
Data correspond to usage on the plateform after 2015. The current usage metrics is available 48-96 hours after online publication and is updated daily on week days.
Initial download of the metrics may take a while.