Open Access
Fig. 7
Download original image
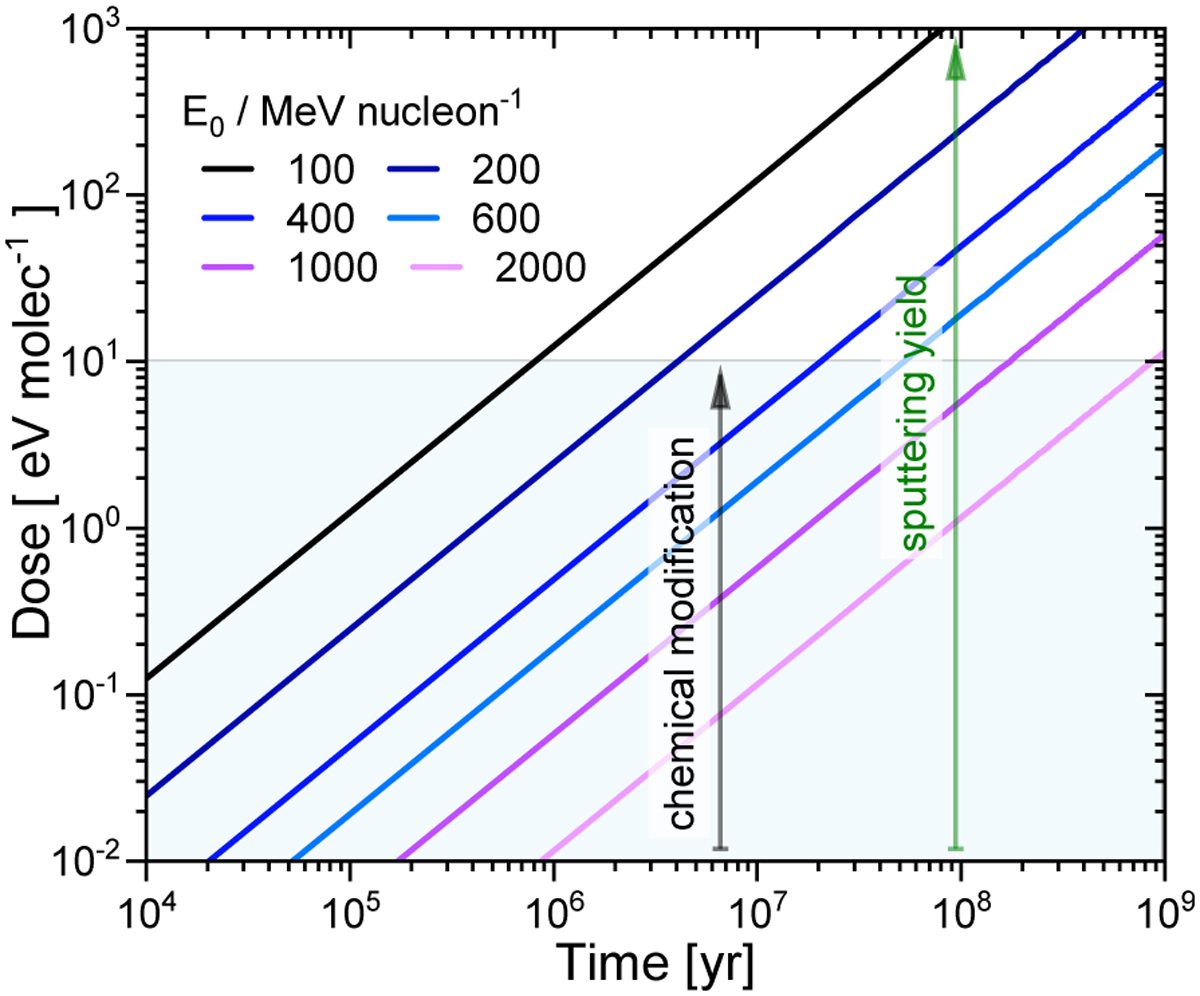
GCR irradiation dose for the ![]() model as a function of time for values of the E0 parameter in the 100–2000 MeV u−1 range (see Eq. (9)). The shaded areas indicate the extent to which chemical changes occur (D < 10 eVmol−1).
model as a function of time for values of the E0 parameter in the 100–2000 MeV u−1 range (see Eq. (9)). The shaded areas indicate the extent to which chemical changes occur (D < 10 eVmol−1).
Current usage metrics show cumulative count of Article Views (full-text article views including HTML views, PDF and ePub downloads, according to the available data) and Abstracts Views on Vision4Press platform.
Data correspond to usage on the plateform after 2015. The current usage metrics is available 48-96 hours after online publication and is updated daily on week days.
Initial download of the metrics may take a while.