Open Access
Fig. 1
Download original image
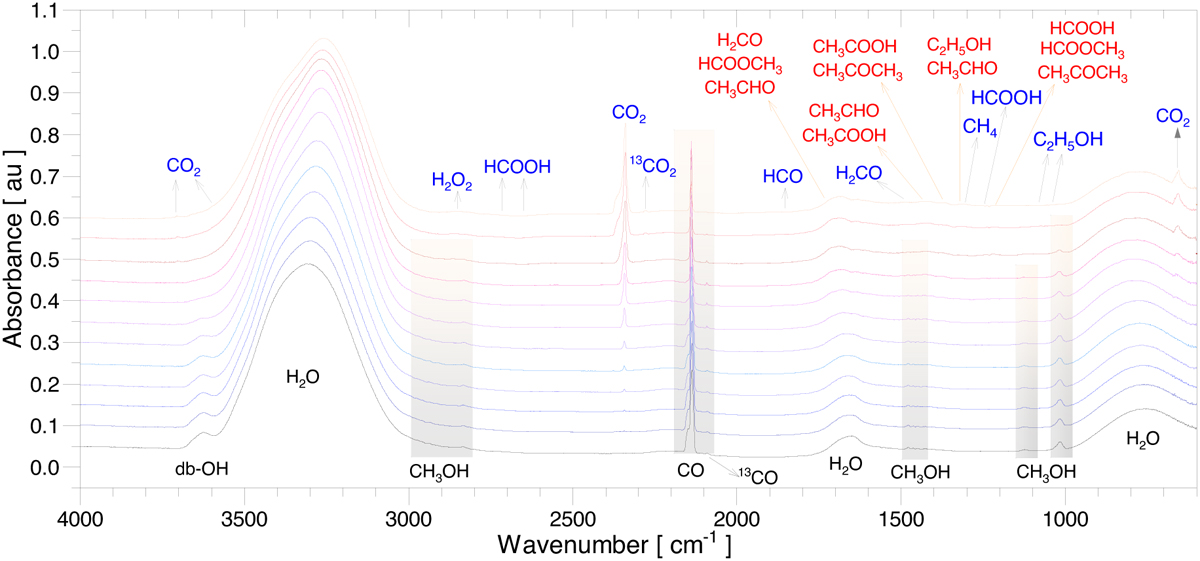
Infrared spectrum (black bottom line) of non-irradiated ice S3 (58:38:3) and the IR spectra of the ice for various irradiation fluences. The precursor molecule bands are marked in black, while those corresponding to products appear in blue and red.
Current usage metrics show cumulative count of Article Views (full-text article views including HTML views, PDF and ePub downloads, according to the available data) and Abstracts Views on Vision4Press platform.
Data correspond to usage on the plateform after 2015. The current usage metrics is available 48-96 hours after online publication and is updated daily on week days.
Initial download of the metrics may take a while.